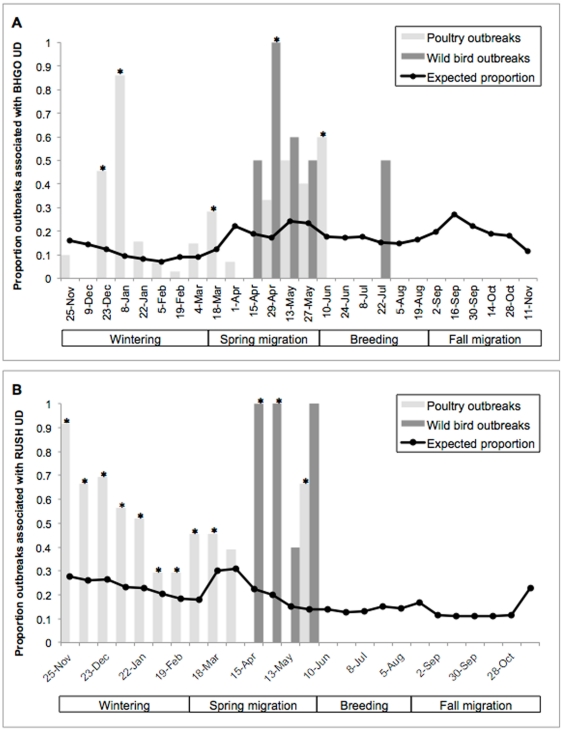
Figure 3. Association of HPAI H5N1 outbreaks with wild bird utilization distributions (UD) during the annual cycle, 2005–2010.
The proportion of outbreaks (grey columns) associated with (a) bar-headed geese and (b) ruddy shelduck UDs is compared to expected values (black line). Significant associations (p≤0.05) are indicated by an asterisk (*).

