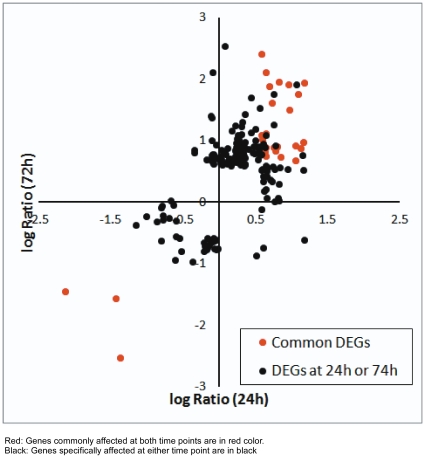
Figure 5. A scatter plot of log2 ratio (logR) for genes whose expression were significantly affected at either 24 h or 72 h post CAPE treatment.
Genes commonly affected at both time points are in red color, while those specifically affected at either time point are in black. IPA analysis of the unique genes (n = 191) genes changed either in 24 h or 72 h CAPE treatment indicated that group of genes regulating several cell functions, including cell proliferation (p-value 9.82×10⁻¹¹, 52 genes), cell growth (p-value 1.40×10⁻¹⁰, 41 genes), cell death (p-value 1.40×10⁻¹², 68 genes), and cell survival (p-value 1.40×10⁻⁶, 27 genes).

