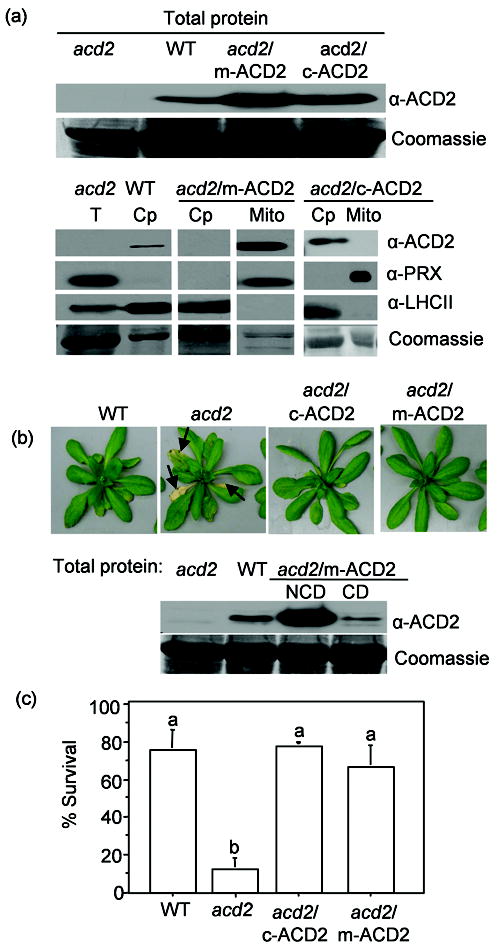
Figure 3. ACD2 either in mitochondria or in chloroplasts significantly suppresses the acd2 cell death phenotype.

Transgenic acd2 carrying ACD2 targeting to mitochondria (acd2/m-ACD2) or chloroplasts (acd2/c-ACD2) were generated and characterized. Experiments were performed with at least two independent transgenic lines per construct; data from representative lines are presented.
(a) The ACD2 level in total protein (T) extracts (upper panel) and in chloroplasts (Cp) and mitochondria (Mito) isolated from the indicated plants was detected by Western blot analysis (lower panel). Organelle purity was assessed using antibodies against PRX II F and LHCII (chloroplasts). Signals of ACD2, PRX II F and LHC II, for all samples are from single exposures of one continuous membrane. This experiment was done three times with similar results.
(b) Phenotypes of 31-d-old plants of the indicated genotype. By day 31, about 20% of acd2/m-ACD2 showed a mild cell death phenotype (see text). ACD2 protein content in the healthy leaves of 21-d-old acd2/m-ACD2 plants that showed mild cell death (CD) and did not show cell death (NCD) on day 21 (lower panel). This experiment was done three times with similar result.
(c) Protoplasts were exposed to light for 15 h and percentage (%) of live cells was determined. This experiment was done four times with similar results and the error bars represent SD (n = 2). Letters indicate different values using Fisher’s PLSD test (P < 0.001).
