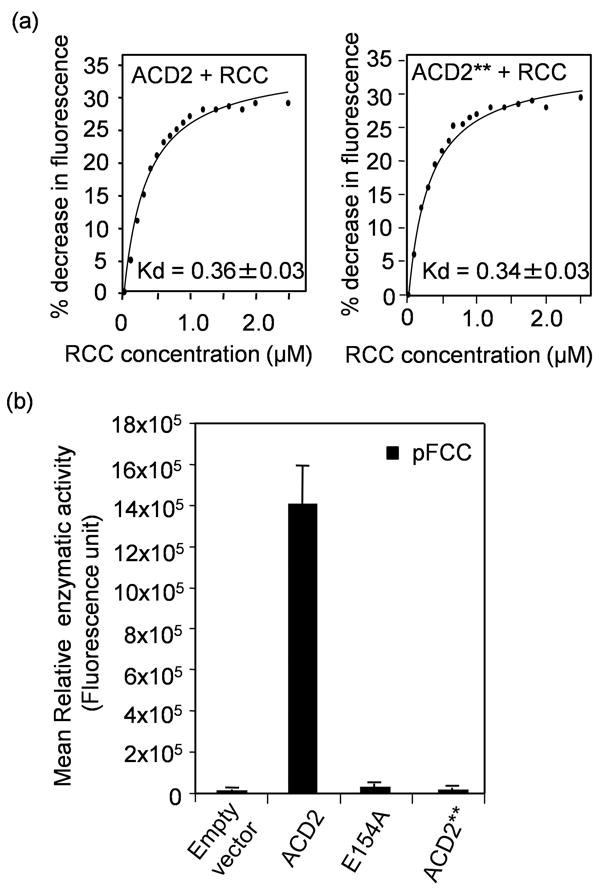
Figure 4. Biochemical characterization of ACD2.

(a) Quenching of endogenous fluorescence of purified wild-type ACD240-320 and ACD2**40-320 (E154AD291H) protein, respectively, by RCC. The percentage (%) decrease in intrinsic fluorescence of the respective proteins caused by RCC binding was plotted against the concentration of RCC and the Kd was found to be 0.36 ± 0.03 μM and 0.34 ± 0.03 μM, respectively. This experiment was done twice with similar results.
(b) Activity of purified recombinant ACD2 or ACD2** or ACD2E154A proteins was assessed in a coupled assay using purified PAO and co-factors (Pruzinska et al., 2007) and pFCC was measured by HPLC. As a negative control, the vector protein alone (pQE 30 in E. coli M15) was used. Error bars represent SD (n=3). This experiment was done twice with similar results.
