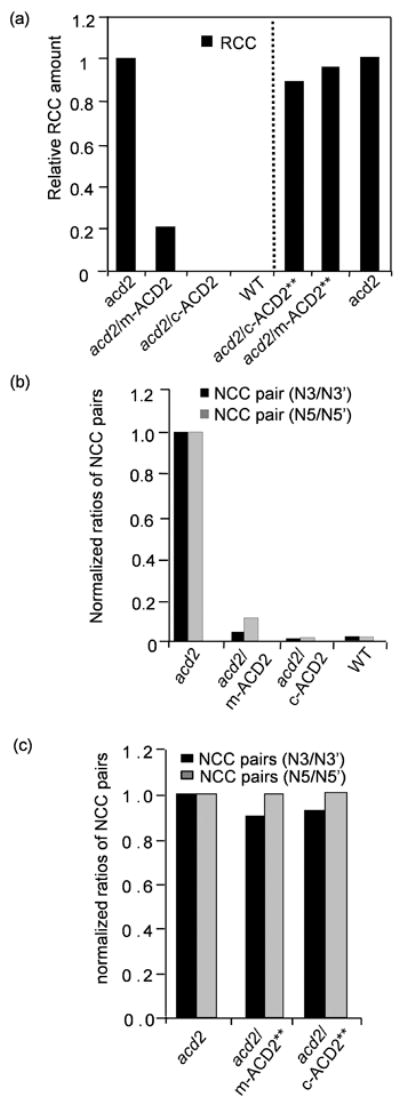
Figure 6. HPLC analysis of chlorophyll catabolites.

(a) RCC levels in extracts of detached leaves incubated for 4 d in dark were quantified by HPLC. Note the relatively higher level of RCC that accumulated in acd2 leaves. RCC was undetectable in WT and acd2/c-ACD2 leaves. The amount of RCC was significantly decreased in acd2/m-ACD2 leaves. RCC levels were high in acd2/c-ACD2** and acd2/m-ACD2** leaves. RCC quantification in acd2/c-ACD2** and acd2/m-ACD2** leaves was done separately from acd2/m-ACD2 and acd2/c-ACD2 extraction.
(b,c) Ratio of NCC stereoisomers in acd2/c-ACD2, acd2/m-ACD2 leaves or in acd2/c-ACD2** or acd2/m-ACD2** leaves normalized to the content in acd2. Note the ratios of NCC stereoisomers were significantly reduced in acd2/c-ACD2, acd2/m-ACD2 plants indicative of ACD2 activity in respective organelles (b). These experiments (a-c) were done twice with similar results.
