
Fig. 4.
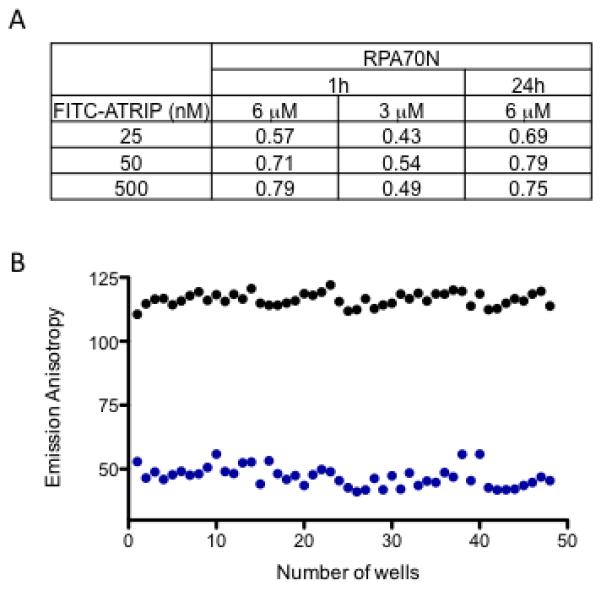
Optimization of assay conditions. (A) Z’ factor determination using different concentrations of RPA70N and FITC-ATRIP. Z’ factor were calculated using two concentrations of RPA70N (6 and 3uM) as a function of three different concentrations of FITC-ATRIP (25, 50, 500 nM) at 1 and 24h to evaluate performance of the fluorescence polarization assay; (B) Optimized conditions were repeated in a 384 well format. The average anisotropy values from free peptide control (blue) and bound peptide control (black) were obtained from 48 wells to calculate the Z’ factor.