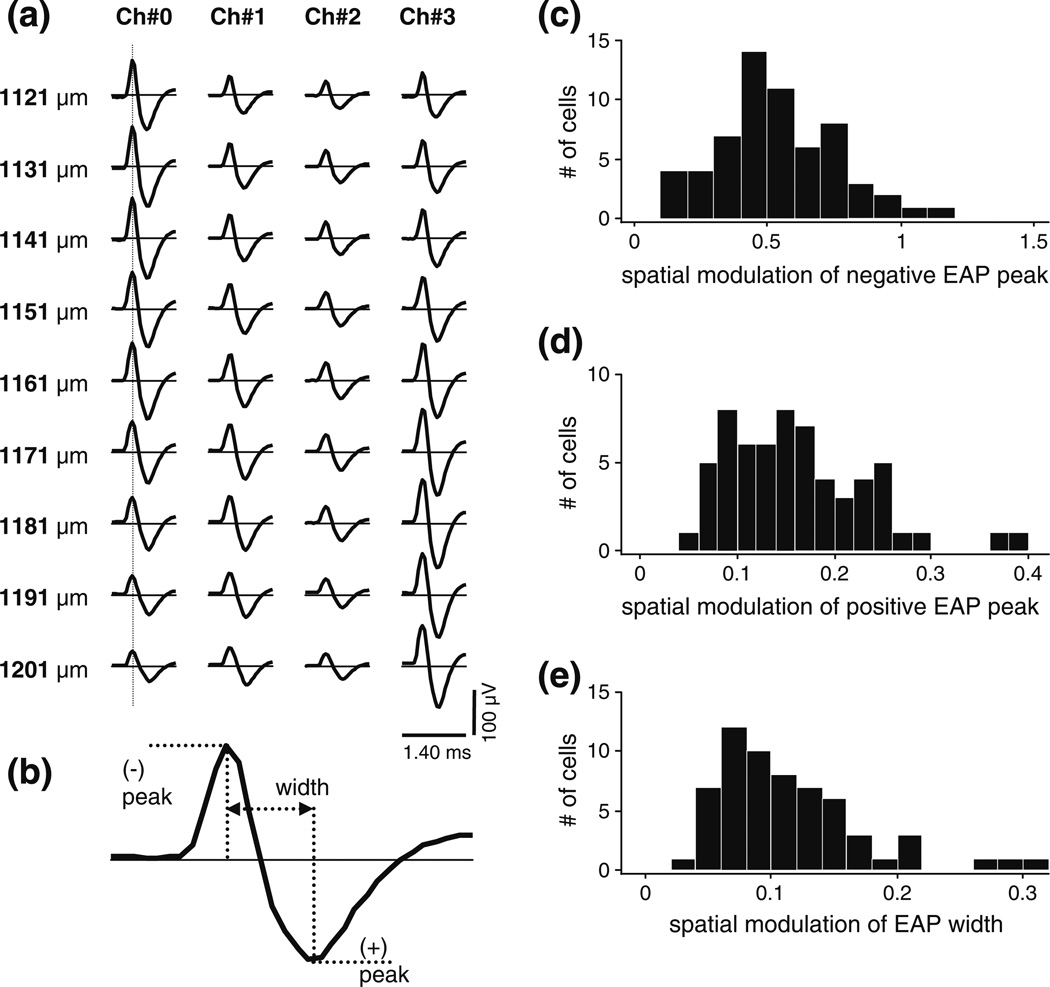
Fig. 1.
Analysis of the spatial variation of the size and shape of the extracellular action potential (EAP) waveform. (a) Example data set recorded from a single unit (cell 4) with a tetrode (06–3200, see Table 1) in 9 equally spaced positions. Rows, labeled by nominal depth along the penetration, show the mean spike waveforms registered by the 4 channels of the tetrode; data from different channels are organized in separate columns. The vertical line indicates the sampling spatial EAP amplitudes at a fixed moment in time (here at the peak). By convention, negative extracellular potentials are plotted above the zero line. (b) Definition of the positive and negative peaks and the width of an EAP. We define an index of the spatial variation of these features by their relative spatial modulation, i.e., by the ratio of the difference of the spatial maximum and minimum to the spatial mean. (c) The distribution of the index of spatial variation of EAP size (the negative EAP amplitude) in the entire sample (N=61) of visual cortical neurons. The sample median was 0.51. (d) The distribution of an index of the spatial variation of EAP shape (the relative size of negative peak over positive peak) in the entire sample. The sample median was 0.15. (e) The distribution of another index of the spatial variation of EAP shape (width). The sample median was 0.10. Note that the horizontal scales in panels (c), (d), and (e) differ

