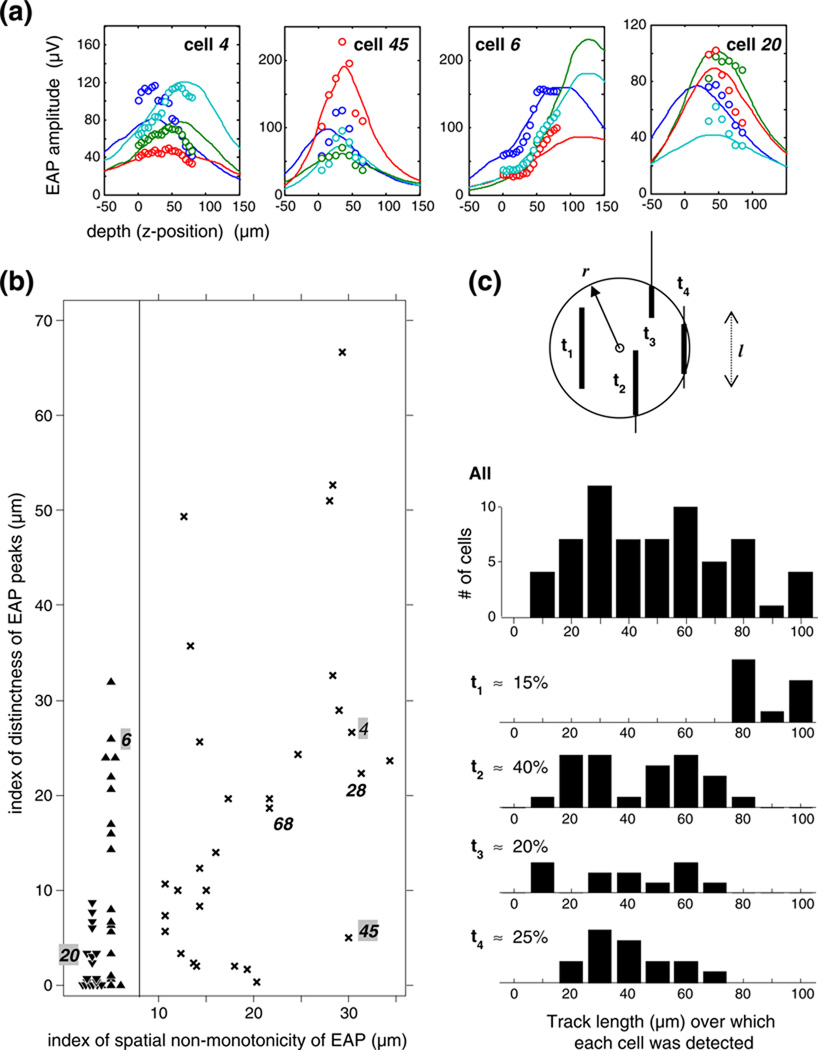
Fig. 2.
Characterization of the diversity of the spatial variation of the EAP amplitude recorded with a stepped tetrode. (a) EAP variation is shown for four cells (tetrode channels are labeled by color); each represents high or low values of either of two shape indices: the index of non-monotonicity and the index of peak distinctness (see text for their definition). The continuous lines are the predictions from the optimal dipole fit. (b) The joint distribution of two indices of spatial EAP variation in the entire sample (N=61). Each symbol represents one cell: up triangles, monotonic increasing EAPs; down triangles, monotonic decreasing EAPs; 'x' symbols, discernible EAP peaks. The vertical line separates the cells of monotonic EAPs from cells of peaking EAPs. Examples featured in the text are numbered. (c) The linear spatial span of EAP’s. Analysis of the distribution of the measured linear span of detectable signal levels in the entire sample (‘All’). The stick and ball model (inset) helps to explain how such distributions depend on the relative size of the full linear span of spatial samples (sticks with fixed length l) detectability radius of neurons (ball with radius r). The thickened portion of a stick indicates the range of detectable EAP’s recorded from an isolated single cell within the full linear span of spatial samples. Their relative position defines 4 subsets of neurons: neurons whose spikes were isolated either (t1) at all positions sampled; or (t2) beginning with the first sample and ending before the last; or (t3) beginning after the first sample and continuing through to the last; or (t4) beginning after the first sample, and ending before the last. The vertical axes in (t1)-(t4) are omitted for clarity but the same vertical scale applies as in ‘All’

