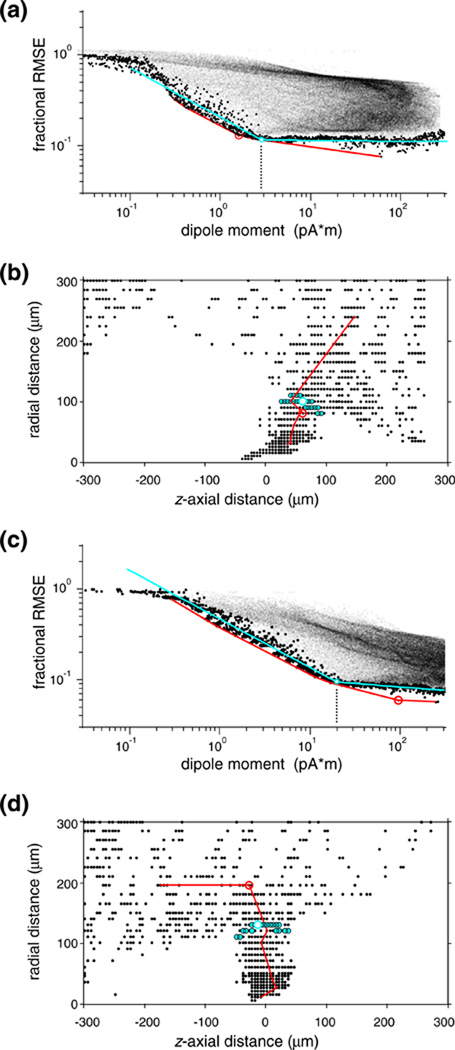
Fig. 5.
L-curve regularization of the optimal dipole for a single visual neuron. (a) The joint distribution of the size (abscissa) of the locally optimal dipole source and the associated residual error (ordinate) between the predicted and measured EAP’s. Each of these model dipoles (fine dots) was calculated by Eq. (7) at one of the node points of a regular cylindrical mesh covering a finite volume surrounding the recording tetrode. Large dots mark data in the lower bound subset, the red line indicates the tangent envelope, and the smooth cyan curve is a 4-parameter empirical L-curve fitted to the lower bound. The L-shaped pattern suggests two model regimes. On the steep left segment, models increasingly well capture genuine physical features of the data at the cost of small increases in the dipole size (and, implicitly, cell-probe separation). The shallow segment to the right corresponds to the noise limit that allows no further improvement in capturing physical features. The optimal equivalent dipole is defined as the data point nearest to the corner point of the L (open circle). The cyan circular halo indicates the neighborhood of the 30 data nearest to the corner point. The point with the largest curvature on the tangent envelope (red circle) corresponds to a similar dipole. (b) Dipole localization of neurons via L-curve regularization is robust. The mapped locations of the locally optimal dipoles that fell within the lower bound subset are plotted in small symbols; the open circle marks the globally optimal dipole. Confirming that the optimization principle was realized, the 30 nearest neighbors of the L-curve corner (indicated by cyan halo in (a)), are mapped in a compact volume (cyan symbols) that represents a choke-point in the distribution; dipoles from the noise-limited flat right limb of the L-curve are mapped in an explosively expanded volume. Cell 10. (c)-(d): another example, illustrating the unstable nature of the prediction by the tangent envelop in discrete sample. In contrast to the corner of the L-curve (cyan circle), the point with the largest curvature on the tangent envelope (red circle) corresponds to physiologically unrealistic dipole parameters). Cell 37

