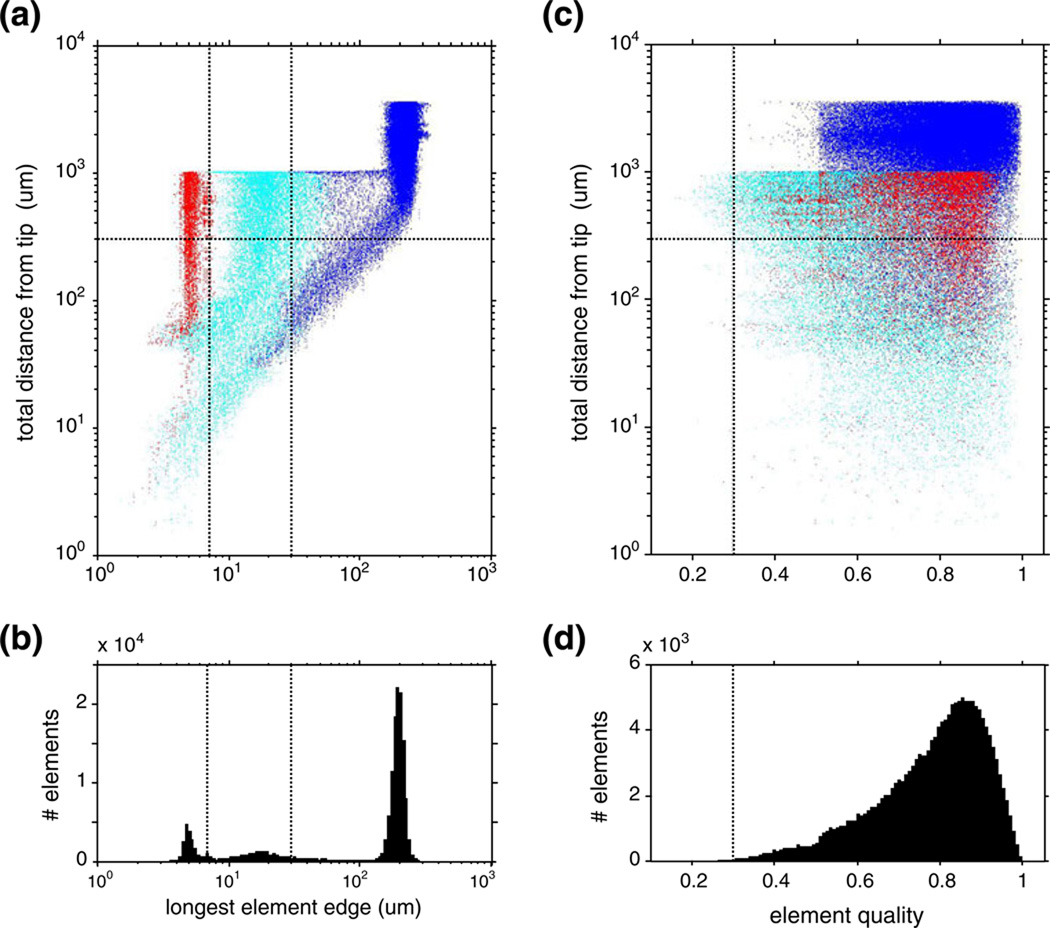
Fig. 7.
(a) The distribution of element size of the finite element mesh, as a function of the distance from the tetrode tip. Colors indicate different domains in the finite element model: wire domain (red), gray matter in neighborhood of tetrode (cyan), and more distant elements (blue). The horizontal dotted line indicates the radius of the region of interest; the vertical dotted lines indicate the characteristic size of tetrode features (see details in text). (b) The marginal histogram of the data in (a). (c)–(d) Distribution of the element quality analyzed similarly to element size. The vertical dotted line indicates minimum element quality recommended for 3-d problems

