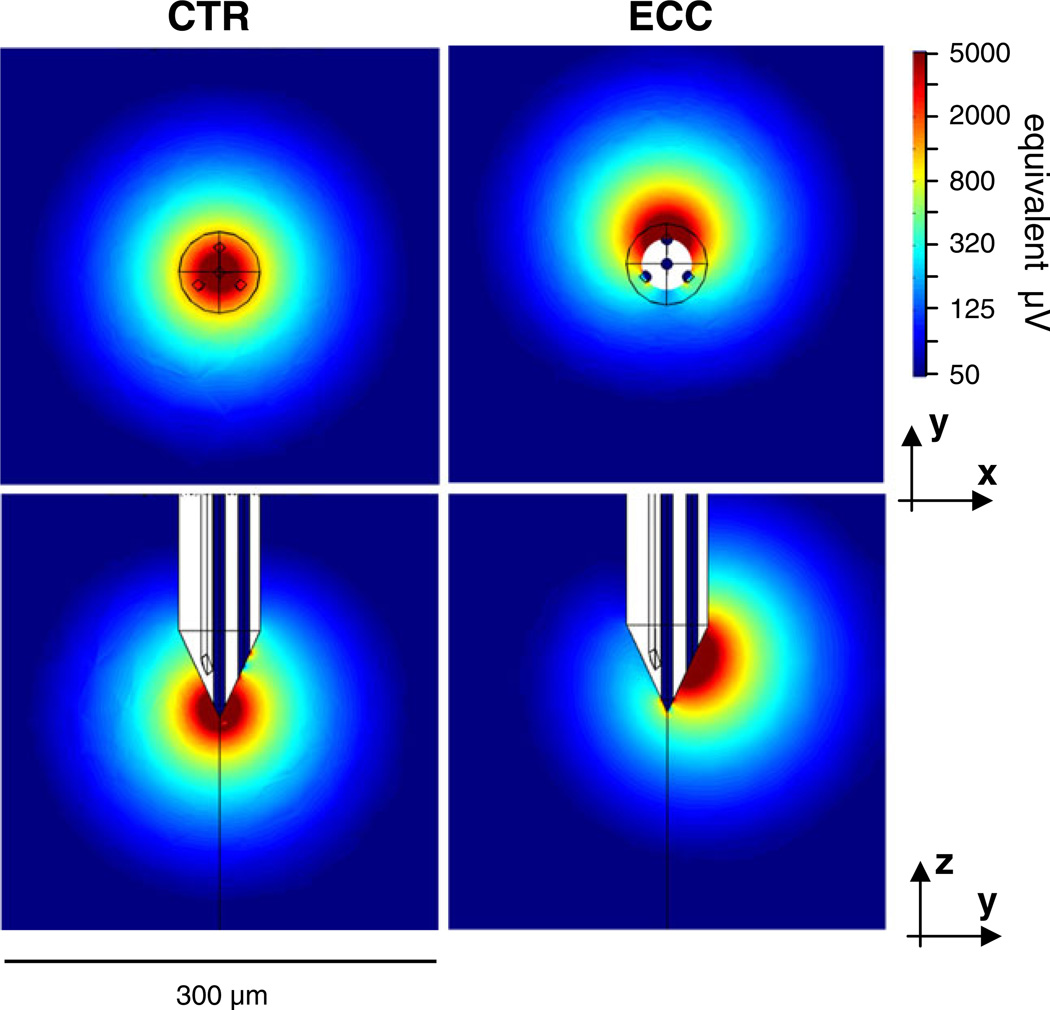
Fig. 8.
The lead fields of a Thomas tetrode, calculated by the finite element method for one of the tetrodes. The parameters of the tip geometry for this tetrode (#03–0591) are listed in Table 1. The images show the lead field strength in color scale for two planar cross-sections for the center lead on the left (x-y plane through the tip point; y-z plane through the vertical axis of the probe), and for one eccentric lead on the right (x-y plane through the center point of the exposed lead surface). The color bar indicates the lead field strength on a log scale after conversion to equivalent probe potentials (µV) that the probe would register for a dipole source whose dipole moment equals 5pA*m (see text for explanation) and whose vector is iso-oriented with the lead field vector at each position in space. The lead field vectors at each point in space are oriented approximately in the direction of the gradients

