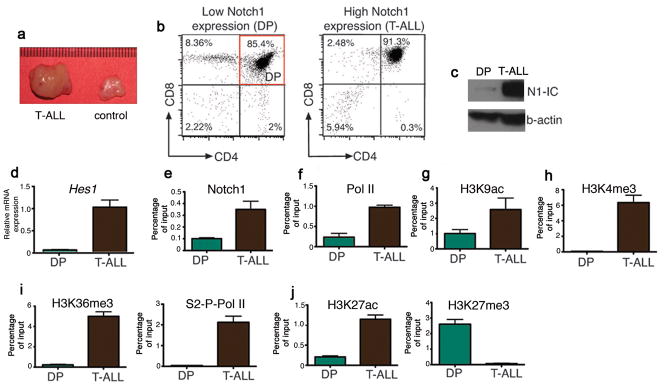
Figure 2.
Notch1-induced epigenetic changes in an in-vivo model of T-ALL. (a) Comparison of the size of the thymus in leukemic animals and control littermates. (b) Cell populations used in this study. (c) Western blot showing the expression of N1-IC in DP and T-ALL cells. (d) Hes1 cDNA levels between DP and T-ALL. (e, f) ChIP of Notch1 and Pol II on the Hes1 promoter in the indicated cell populations. (g-j) ChIP of the indicated histone marks and S2-P-Pol II in DP and T-ALL cells.

