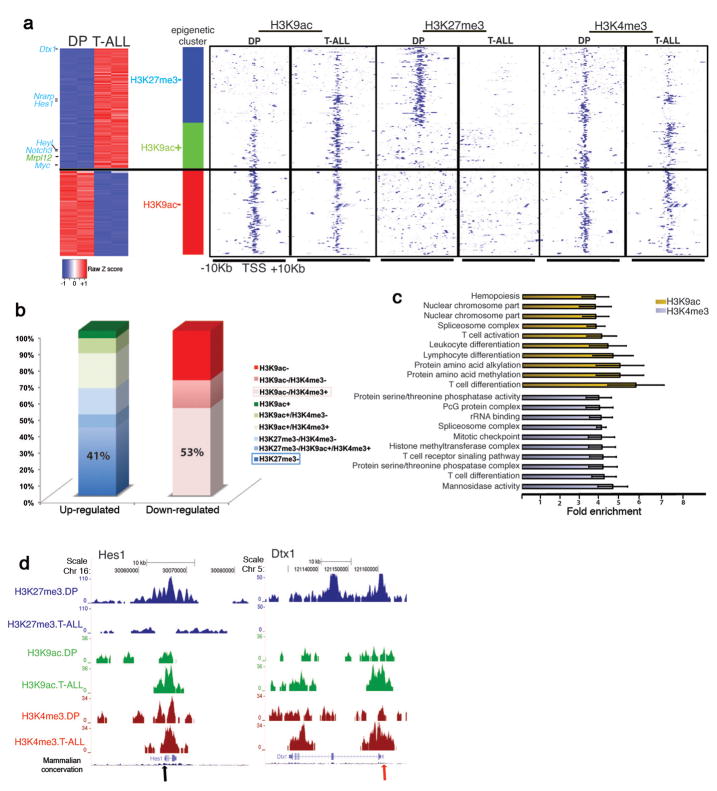
Figure 3.
Characterization of T-ALL epigenetic landscape using ChIP-Seq for H3K9ac, H3K4me3 and H3K27me3. (a) Cluster of the major gene expression changes between T-ALL and DP and the accompanied epigenetic changes. Left part: Expression heatmap representing up (red)- and down (blue)-regulated genes with significant epigenetic changes. Right panel: Heatmap representation of the epigenetic marks in T-ALL and DP in TSSs of selected genes. “+”:gain and “−”:loss in the levels of epigenetic mark in T-ALL versus DP. Loss of H3K27me3 (P=6.91x10⁻²², blue bar) and gain of H3K9ac (P=1.52x10⁻⁴, green bar) are enriched in up-regulated genes, whereas loss of H3K9ac (P=2.79x10⁻¹⁹, red bar) is enriched in down-regulated genes. (b) Bar graphs indicate the percentage of genes characterized by each modification in T-ALL cells. The plus and minus signs are used as above. Pink and blue frames: prevalent epigenetic clusters in down-regulated and up-regulated genes, respectively. (c) Functional annotation of epigenetic changes (T-ALL vs DP) in H3K9ac (yellow bars) and H3K4me3 (gray bars) shows enrichment in specific biological processes. (d) ChIP-Seq results for two well-characterized Notch1 targets, Hes1 and Dtx1 (arrows denote the TSS).

