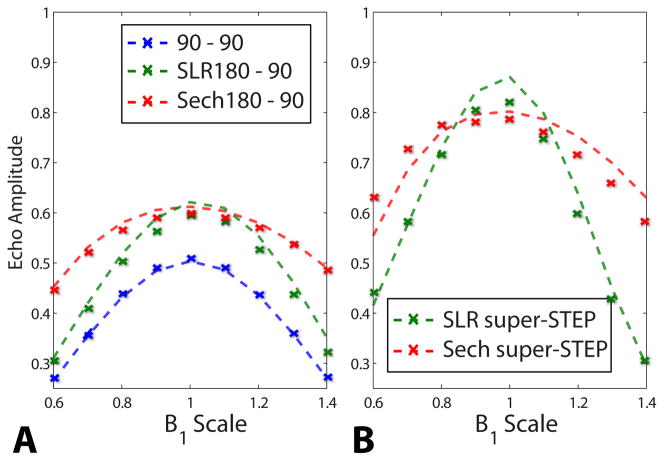
Fig. 5.
Phantom tests of the B1 response for STE and super-STE. (A) Comparison for various STEAM encoding schemes (Fig. 1A,B). (B) Comparison for various STEP schemes (Fig. 1D). The dashed lines are simulated profiles and X’s are acquired data, corrected for T2 relaxation of the phantom. Note that the simulation curves include B1 variations for all pulses, including the excitation pulses.

