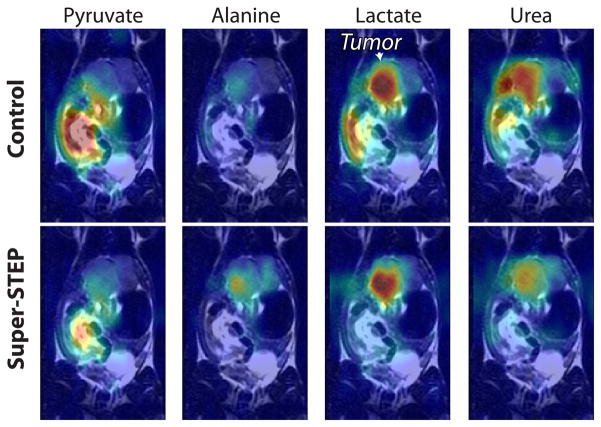
Fig. 9.
Preliminary liver tumor model 13C data overlays with and without a super-STEP (beff = 119.4 s/mm2). (Color scale is same as Fig. 7.) In this experiment, 13C-urea was co-polarized with [1-13C]-pyruvate and both compounds were injected. As in the TRAMP, the STEP highlights the lactate in the tumor. The urea signal is also better localized to the tumor with the perfusion weighting, suggesting it is better perfused into the tumor tissue compared with other tissues.

