
Figure 4.
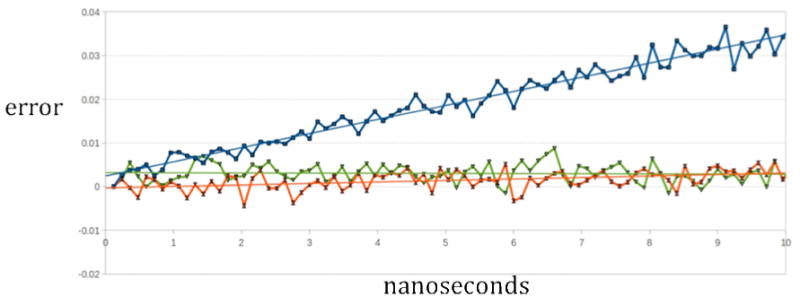
Energy drift for DHFR expressed as percentage of the relative error. We plot [100 ((Et-E0)/E0)] (where Et is the energy at time t and E0 is the initial energy) as a function of time given in nanoseconds. Data are obtained from 10 nanosecond simulations. Blue squares correspond to 6th entry in table 2 (PME 64SP, Quad-4096, NB Force add SP, SHAKE all bonds). Green triangles correspond to 1st entry in table 2 (PME 64DP, Quad-4096, NB Force add DP, SHAKE all bonds) and orange hourglass to third entry in table 2 (PME 64DP, Quad-4096, NB Force add SP, SHAKE all bonds). The linear regression lines (same colors) can be interpolated to 1000 ns to get the drift per microsecond (values in column 6 of table 2). Since |E0| is ∼60000, an increment on the y-axis of 0.01 is about 6 kcal/mol. Note the significant drift when Particle Meshed Ewald is computed in single precision (PME 64SP). Note also the small improvement obtained when the non-bonded interactions are added on the GPU in double precision (NB Force add DP). The linear fits of the green and orange curves have significant error in their linear slopes. The error of the linear slope of the blue curve is smaller.