Figure 1.
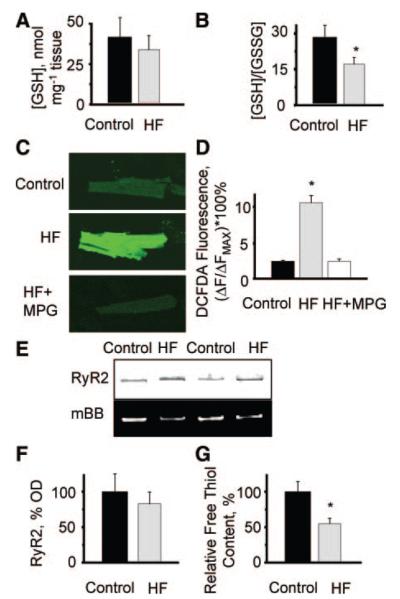
Increases in oxidative stress, ROS formation, and RyR2 oxidation in heart failure. A, Averages of the levels of reduced form of glutathione (GSH) measured in tissue homogenates from normal (38.9±14.6 nmol per mg tissue) and failing hearts (29.4±11.2 nmol per mg tissue). B, Averages of ratios of reduced to oxidized glutathione (GSH/GSSG) measured in tissue homogenates from normal (28.6±10.4) and failing hearts (17.7±5.1). *P<0.05 (n=9 and 8 for control and HF, respectively). C, Fluorescence of the ROS-sensitive indicator DCFDA loaded into myocytes from normal and failing hearts. Representative images of DCFDA-loaded cells from control (top) and failing hearts under basal conditions (middle) and after 30 minutes of incubation with 800 μmol/L MPG (bottom). D, Summary graph for averages of DCFDA fluorescence normalized to the signal in the presence of 10 mmol/L H2O2 (Fmax) measured in myocytes from control hearts (2.47±0.09) and myocytes from failing hearts under basal conditions (10.77±1.01) and in the presence of MPG (2.48±0.28). *P<0.05 vs control (n=21 to 32). E, Representative images of Coomassie-stained gels and mBB fluorescence intensity of RyR2 from normal and failing hearts. F, Pooled data for RyR2 content in samples from normal vs failing hearts. G, Relative free thiol content (%) of RyR2s from control vs HF samples obtained by normalizing mBB fluorescence to RyR2 level. *P<0.05 vs control (n=10).

