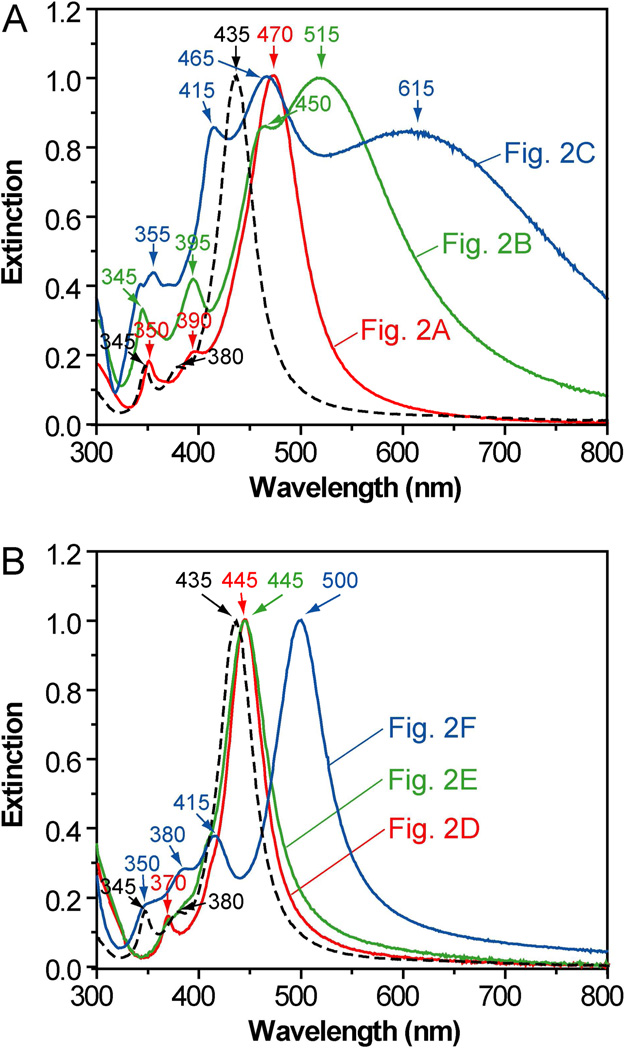
Figure 8.
Normalized UV-vis spectra of samples shown in Figure 2 (as marked on the spectra). Dashed curves correspond to UV-vis spectra of the 40-nm Ag cubes serving as the seeds. The peak positions are labeled on each spectrum and their assignments can be found in the text.

