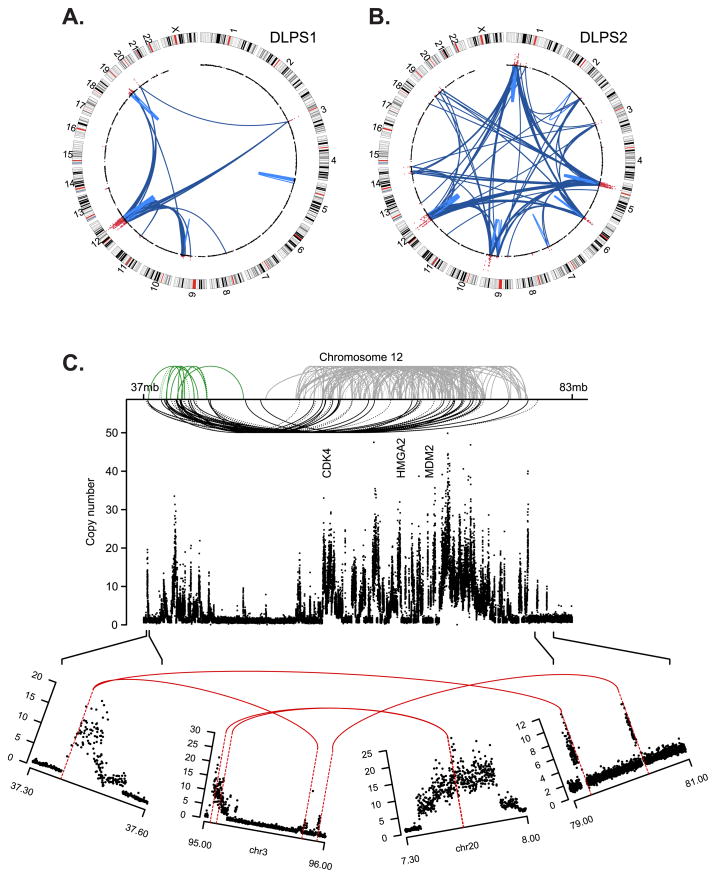
Figure 1. Somatic rearrangements in two sarcomas.
Structural rearrangements and DNA copy number alterations detected in two retroperitoneal liposarcoma genomes, a primary tumor, DLPS1 (A) and a local recurrence, DLPS2 (B). Chromosomes are plotted in the outer ring with the centromeres indicated in red. DNA copy number data inferred from whole-genome sequencing is indicated in the inner ring with genomic amplifications highlighted (red). Structural rearrangements are edges between two indicated loci, either intra-chromosomal (light blue) or inter-chromosomal (dark blue). C. The remodeling of chromosome 12 in DLPS1 is shown across ~46Mb of the q-arm. Three clusters (green, gray, and black) of both inverted and non-inverted intra-chromosomal rearrangements (dotted and solid, respectively) are shown spanning the progressive amplicon (copy number as indicated, y-axis). Three landmark genes (CDK4, HMGA2, and MDM2) are annotated. In the lower panel, the amplicon structure and rearrangement pattern of the 5’-most and 3’-most breakpoints are shown, indicating a circular structure including interspersed sequences from chromosomes 3 and 20, on top of which the complex pattern of intrachromosomal rearrangements (top) were likely acquired through successive rounds of unstable replication.

