Table 1.
Inhibition of HIV-1 binding to the DC-SIGN receptor expressed on Raji cells
|
HIV-1 envelope pseudovirus |
 |
b Percentage inhibition | ||
| c GRFT | CV-N | SVN | ||
| Subtype C | ||||
| COT9.6 | 56.4 ± 1.0 | 69.1 ± 1.8 | 34.8 ± 18.9 | |
| CAP63.A9J | 37.9 ± 3.2 | 68.4 ± 2.9 | 39.1 ± 11.9 | |
| Du156.12 | 27.7 ± 5.9 | 34.1 ± 2.0 | 19.7 ± 0.9 | |
| Du151.2 | 16.5 ± 7.6 | 46.6 ± 0.4 | 28.5 ± 6.0 | |
| COT6.15 | 9.8 ± 3.7 | 46.7 ± 22.5 | 43.9 ± 3.2 | |
| Median | 27.7 | 46.7 | 34.8 | |
| Subtype B | ||||
| CAAN5342.A2 | 66.8 ± 0.6 | 89.7 ± 0.3 | 50.3 ± 13.0 | |
| PVO.4 | 64.3 ± 23.2 | 82.3 ± 20.6 | 57.9 ± 26.4 | |
| QH0692.42 | 40.1 ± 11.1 | 63.7 ± 2.6 | 50.8 ± 11.7 | |
| Median | 64.3 | 82.3 | 50.8 | |
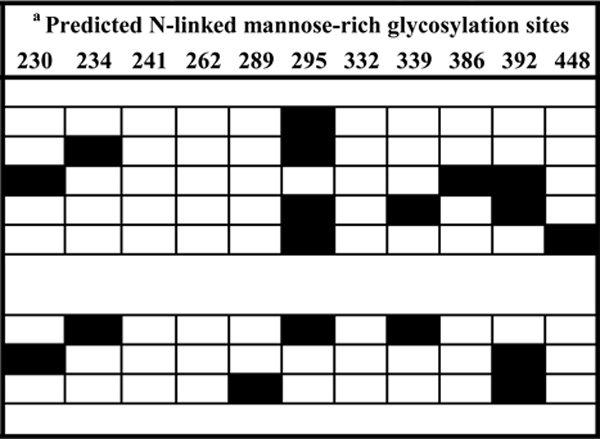
Mannose-rich glycosylation sites were identified from the amino acid sequence of each envelope clone (related to HxB2) based on a study using monomeric gp120 (Leonard et al., 1990). Absent glycans are indicated by black boxes.
The percentage inhibition was tested at 345 nM, 450 nM and 1030 nM of GRFT, CV-N and SVN, respectively.
Viruses are ranked according to their sensitivity to GRFT.
