
Figure 1.
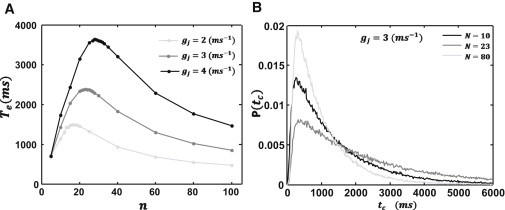
System size dependence of the mean first passage time. (A) Plot of the MFPT Te versus number of cells n. Plots are for three values of the gap junction conductance gj. The model parameters used are gk = 0.1 ms−1, Ix = 6.0 A/F, νc = 31.4 mV, α = 0.003 ms−1, β = 0.009 ms−1, and Δx = 150 μm. (B) Plot of the first passage time probability distribution for three system sizes. Distribution was computed using 105 independent simulations.