
Figure 4.
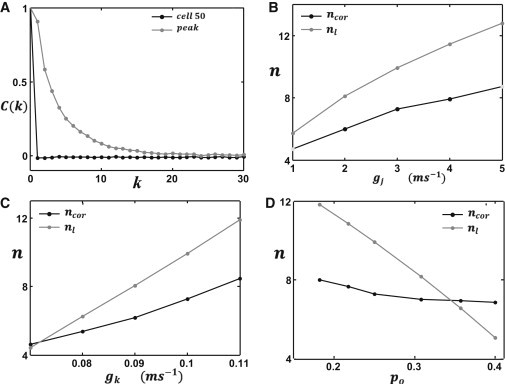
Comparison between numerical and analytical predictions for the liminal length. (A) The correlation function C(k) computed near the peak voltage (gray line) and near an arbitrary cell (black line). In this simulation we have picked the 50th cell on the cable. (B–D) The liminal length (nl) computed analytically using Eq. 20 (gray line) along with the correlation length (ncor) near the peak voltage (black line): computed as a function of (B) gap junction conductance gj, (C) IK1 conductance gk, and (D) SCR probability po.