
Figure 1.
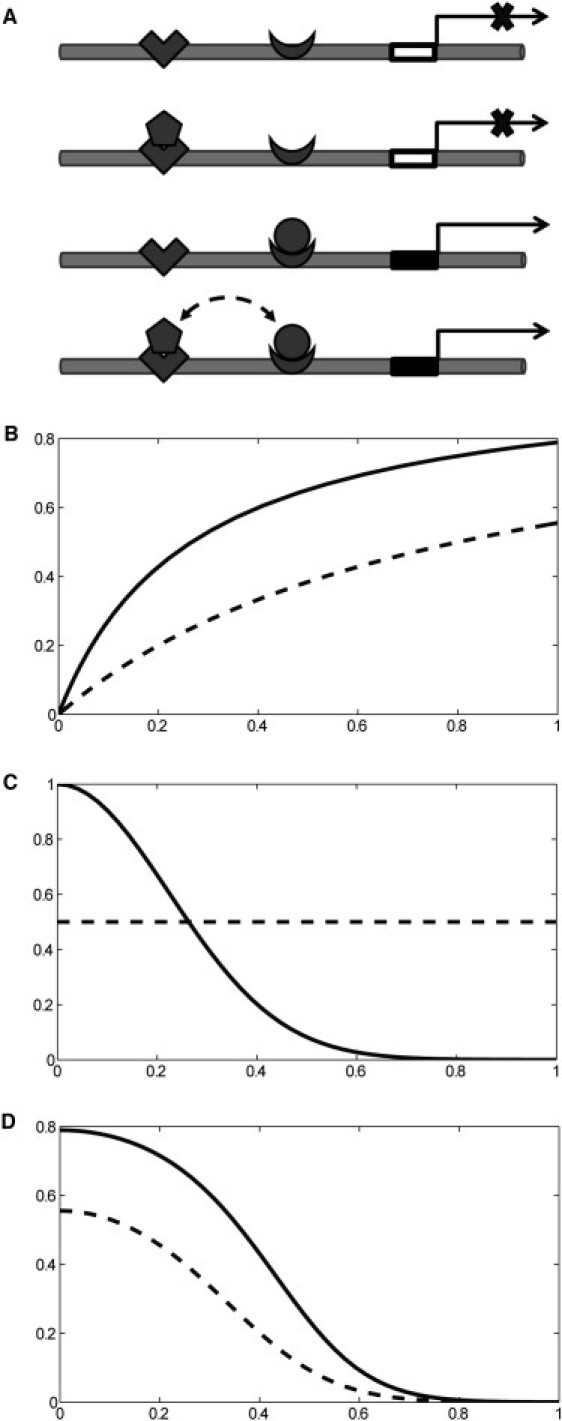
Site occupancy model for gene regulation by the graded factor, A (circle), and the uniform factor, B (pentagon). (B) Activity of the regulatory region as a function of the level of the graded factor in the presence and absence of the uniform factor (solid and dashed lines, respectively). (C) Spatial distributions of the concentrations of graded and uniform factors, CA and CB, respectively; x denotes the distance from the point that corresponds to the maximum of CA. (D) Spatial pattern of the activity of the regulatory region in the presence and absence of the uniform factor (solid and dashed lines, respectively).