
Figure 2.
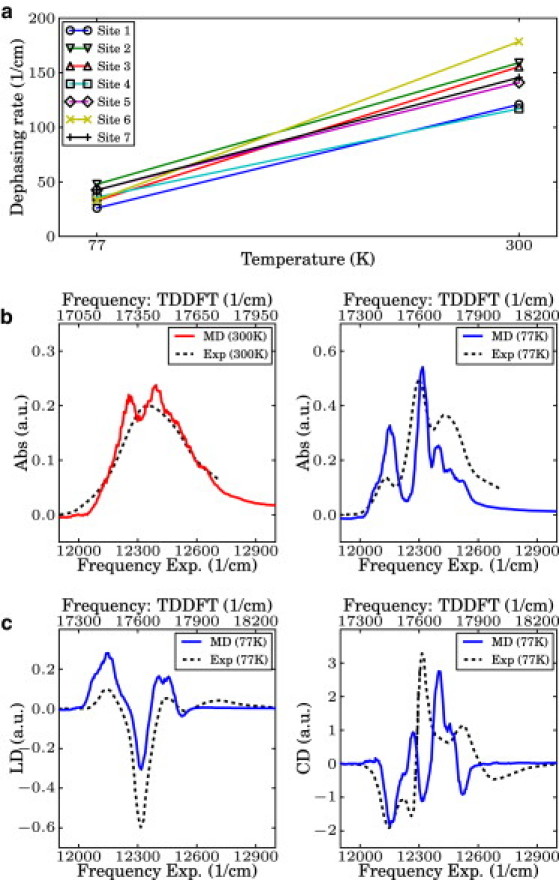
(a) Calculated dephasing rate for each site at 77 K and 300 K. (b) Simulated linear absorption spectra of the FMO complex at 77 K and 300 K. They were shifted to be compared to the experimental spectra as obtained by G. Engel (University of Chicago, personal communication, 2011). (c) Simulated linear dichroism (LD) and circular dichroism (CD) spectra at 77 K. Experimental spectra were obtained from Wendling et al. (44). Although TDDFT-calculated spectra shows systematically overestimated site energies, the width and overall shape of the spectra is in good agreement.