
Figure 4.
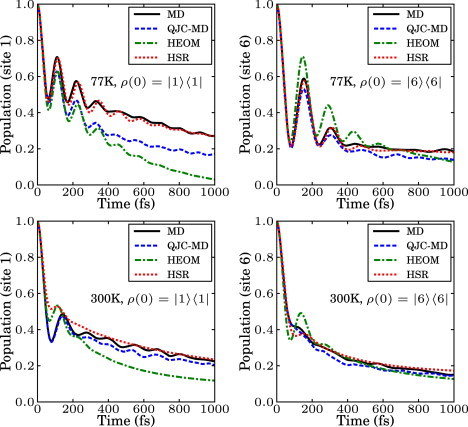
Comparison of the population dynamics obtained by using the MD method, the corrected MD, the hierarchy equation of motion approach, and the Haken-Strobl-Reineker model at 77 K and 300 K. (Right panels) Initial state in site 1; (left panels) initial state in site 6. All methods show similar short-time dynamics and dephasing, whereas the long time dynamics is different and the different increases as relaxation is incorporated in the various methods.