
Figure 1.
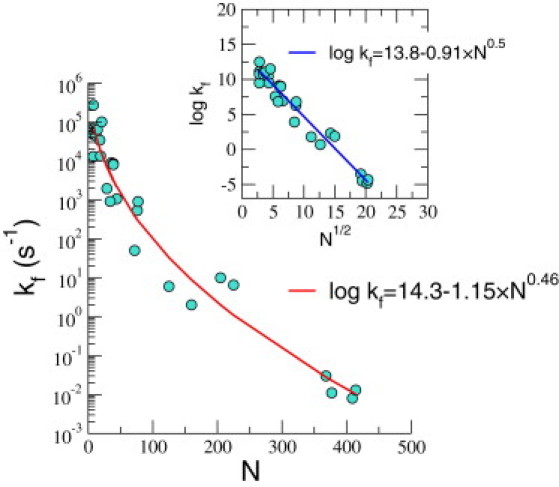
Dependence of the folding rates of RNA on N. The circles are experimental data and the line is the fit obtained using , with β used as an adjustable parameter. Inset shows the fit obtained by fixing β to the predicted theoretical value of 0.5.