
Figure 4.
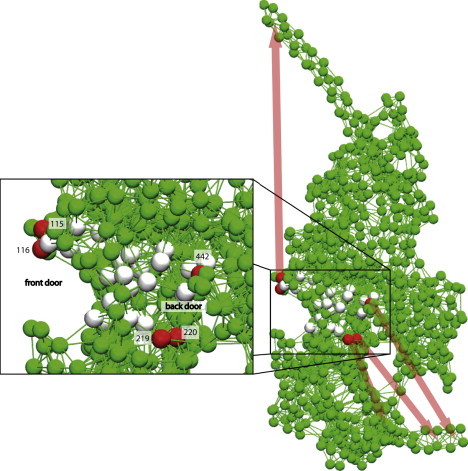
Sensitivity of residues in the NBP region. Directions of communication are indicated by colored arrows. (Inset) Enlargement of the region of the NBP outlined by the box. Residues most sensitive with respect to tail motion and conformational changes in the actin cleft are colored red. Responses induced by the forces applied at the gray colored residues are weaker.