
Figure 6.
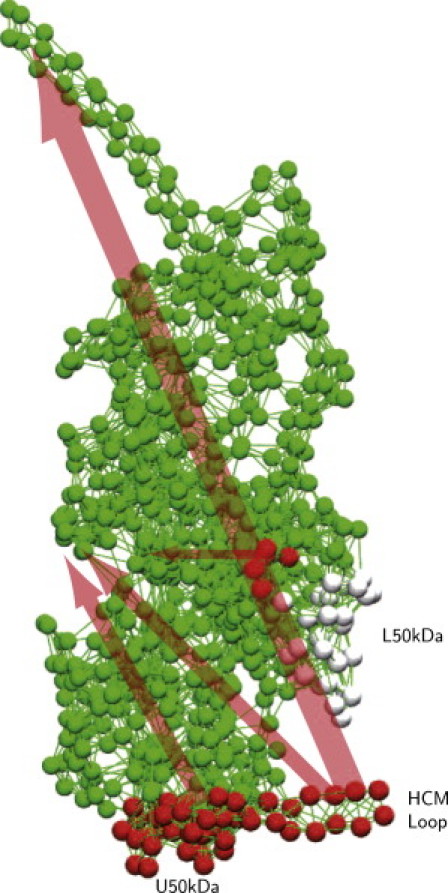
Responses induced by the application of forces to residues in the actin-binding cleft region. Red spheres indicate residues 377–390 in the HCM loop, 340–350 in the upper 50-kDa subdomain, and 540–544 in the lower 50-kDa subdomain. Gray spheres represent less sensitive residues in the lower 50-kDa subdomain. Arrows schematically indicate the directions and strength of intramolecular communication.