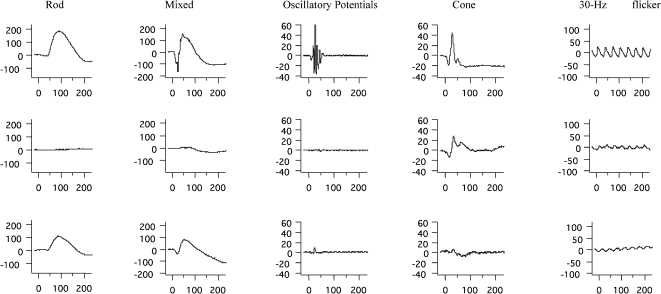
Figure 1.
Representative standard full-field ERG waveforms (rod, mixed, oscillatory potentials, cone, and 30 Hz-flicker responses) with amplitudes in μV (Y axis) and time in ms (X axis) from a healthy age-matched subject (upper panels), a patient with Bardet-Biedl syndrome (case #2) presenting rod-cone dystrophy (middle panels), and a patient with Bardet-Biedl syndrome (case #3) presenting cone-rod dystrophy (lower panels).

