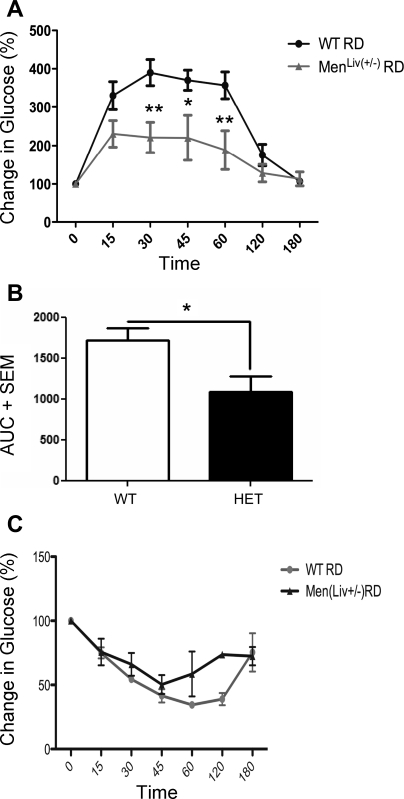
Fig. 8.
Glucose metabolism in mice with liver-specific hemizygote expression of menin. A: glucose tolerance tests (n = 5/group) in liver-specific hemizygote mice [MenLiv(+/−)] and control litter mates (WT). B: area under the curve of glucose tolerance test for liver-specific HET relative to same-strain WT. C: insulin tolerance tests (n = 5/group) in liver-specific hemizygote mice [MenLiv(+/−)] and WT. **P < 0.01; *P < 0.05.

