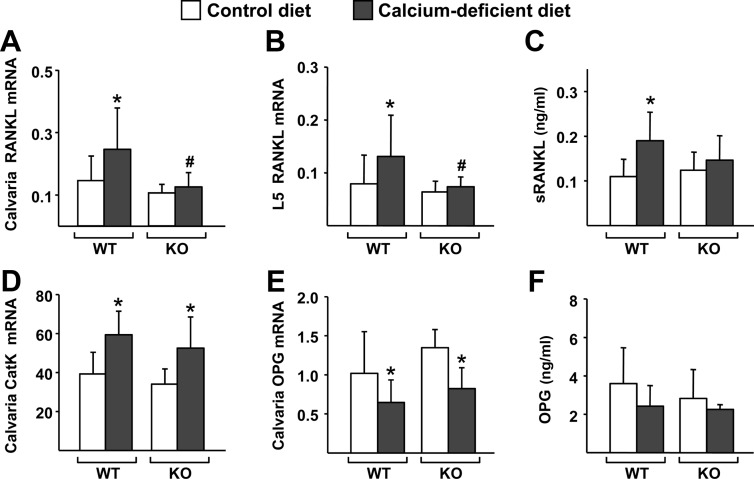
Fig. 4.
The DCR is required for the increase in RANKL caused by dietary calcium deficiency. A and B, Quantitative RT-PCR analysis of RANKL mRNA levels in calvaria (A) and L5 vertebrae (B) of WT and DCR KO mice. C, sRANKL levels measured from blood plasma of WT and KO mice. D and E, Quantitative RT-PCR analysis of cathepsin K (CatK) (D) and OPG (E) mRNA levels in calvaria of WT and DCR KO mice. F, OPG protein levels measured from blood plasma of WT and KO mice. All quantitative RT-PCR values were normalized to ribosomal protein S2 mRNA levels and are the mean of 10–11 animals per group. Blood plasma protein values are the mean of 9–10 samples per group. All statistical comparisons were done using two-way ANOVA. *, P < 0.05 effect of diet within genotype; #, P < 0.05 effect of genotype within diet.

