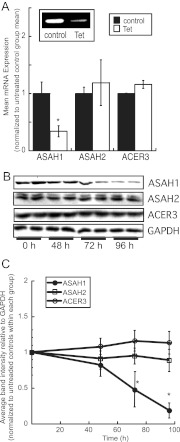
Fig. 1.
Characterization of the H295R ASAH1KD cell line. A, ASAH1KD cells were treated with 5 μg/ml tet for 48 h, total RNA was harvested, and ASAH1, ASAH2, and ACER3 mRNA levels were quantified by qRT-PCR and normalized to the mRNA expression of β-actin. Inset, Representative agarose gel of qRT-PCR products from ASAH1 mRNA transcripts. Data are graphed as mean ± sem of three separate experiments, each done in triplicate. Asterisks indicate statistically significant differences from untreated controls (P < 0.05). B, ASAH1KD cells were treated with 5 μg/ml tet for 48, 72, or 96 h, cell lysates were harvested and separated by SDS-PAGE followed by Western blotting using antibodies against ASAH1, ASAH2, ACER3, and glyceraldehyde-3-phosphate dehydrogenase (GAPDH). C, Densitometric analysis of Western blots of ASAH1, ASAH2, and ACER3 protein expression in, normalized to GAPDH protein content in ASAH1KD cells treated for 0–96 h with 5 μg/ml tet. Data graphed represent the mean ± sd of three separate experiments, each done in duplicate. Asterisks denote statistically significant difference (P < 0.05) when compared to untreated control groups.

