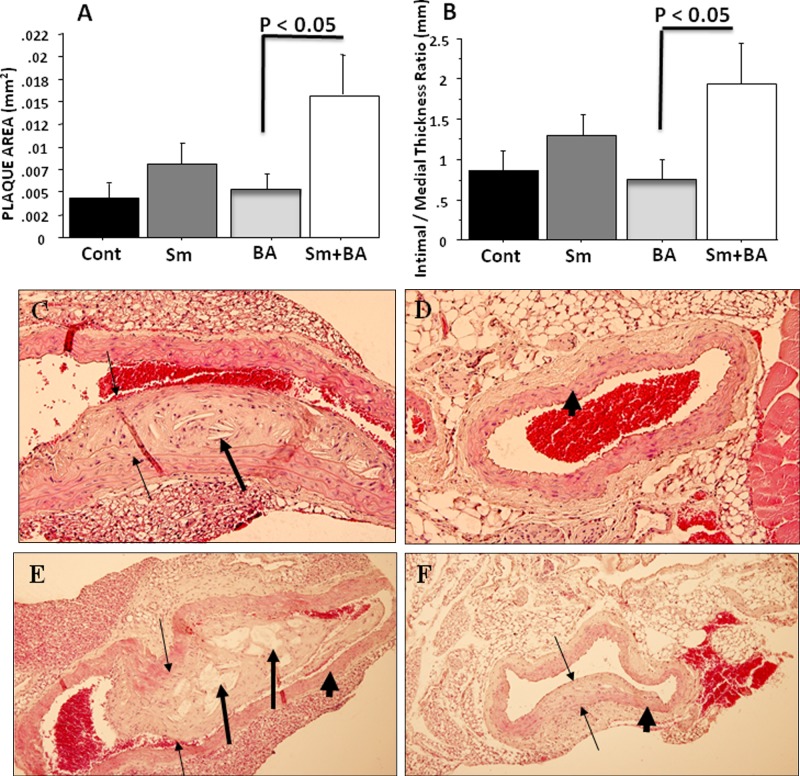
Figure 2.
Bar graphs of morphometric analysis of mean ascending, thoracic, and abdominal aortic plaque area at 18 wks follow-up (A) (N = 4). Total data comparison for plaque area was examined. Bar graphs of ascending, thoracic, and abdominal aorta intimal/medial thickness ratios (B) (N = 4). Total data comparison for intimal-medial-thickness ratios was examined. Sm indicates Streptococcus mutans; BA indicates balloon angioplasty (sham-infected control); and Cont indicates sham-infected control without BA. Histologic evaluation of H&E-stained plaque area in aortic cross-sections at 18 wks demonstrates increased plaque area and intimal/medial thickness ratios after BA in the presence of S. mutans infection (18 wks). (C) S. mutans (magnification 20×); (D) sham-infected control (20×); (E) S. mutans+BA (10×); (F) BA only (10×). Thin arrows indicate plaque margins, thick arrows indicate plaque with cholesterol crystals, and arrowheads indicate arterial wall.

