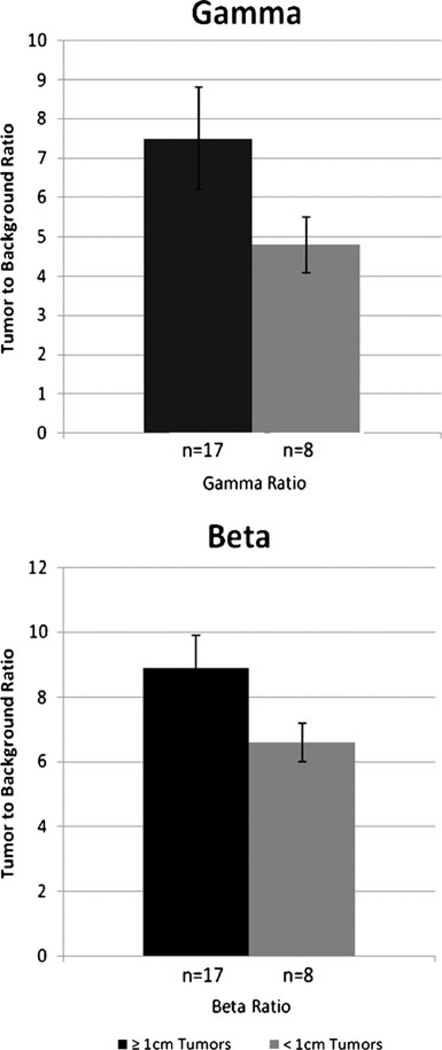
Fig. 3.
Gamma and beta TBR of tumors larger versus smaller than 1 cm in diameter. Higher values are noted over the larger tumor group for both probes. A smaller difference between the groups is noted on the beta probe. This underscores the improved limits of detection that could be obtained by this probe. SEM of both probes are shown for comparison. n number of tumor sample, SEM standard error of the mean

