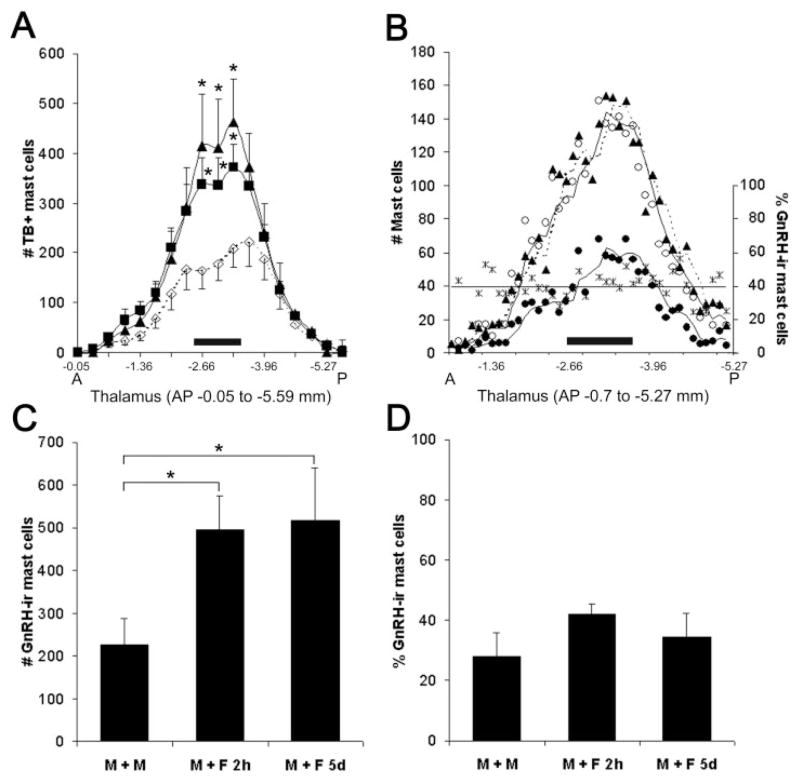
Figure 4.
Effect of cohabitation on thalamic mast cell number and phenotype. (A) Distribution of TB positive mast cells along the anterior- (A) posterior (P) extent of the thalamus in males exposed to sexually receptive females for 2 h (■), 5 days (▲), or cohabiting with familiar males (◇). The midthalamic region (−2.66 to −3.64 mm, represented by a solid horizontal bar) contained the most mast cells. Data points correspond to the average number of mast cells in bins spanning 300 μm. * Two hours and 5 days versus familiar males, p < 0.02. (B) For a representative animal (M+F 5 days), the distribution (left y axis; generated by a moving average trend line, Excel) of mast cells stained with various markers and the proportion (right y axis) of GnRH-I- IR mast cells along the A-P extent of the thalamus are shown. Each data point corresponds to the number of mast cells in each consecutive 50 μm section. For all three markers used, peak numbers of mast cells occur in the midthalamus (horizontal bar). Note that serotonin (○) and TB (▲) markers indicate similar number and distribution of mast cells. The number of mast cells double-labeled for GnRH-I and serotonin (●) shows the same general rostral to caudal distribution. The percent of double-labeled GnRH-I-and serotonin-IR mast cells (*) remains constant (represented by a best fit line). (C) The number of double-labeled (GnRH-I- and serotonin-) IR mast cells in the midthalamus is greater in male rats paired with females for 2 h (M+F 2 h) or 5 days (M+F 5 days) than in those housed with familiar males (M+M), * p < 0.05. (D) The proportion of GnRH-I- to serotonin-IR mast cells in the midthalamus is similar in all three experimental groups. For (A), (C), and (D), values represent the mean ±S.E.M.

