
Fig. 1.
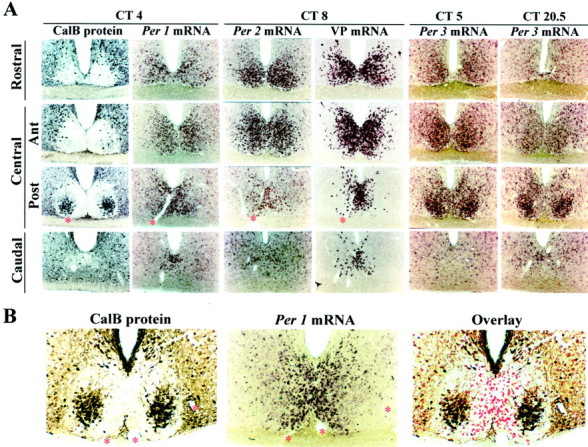
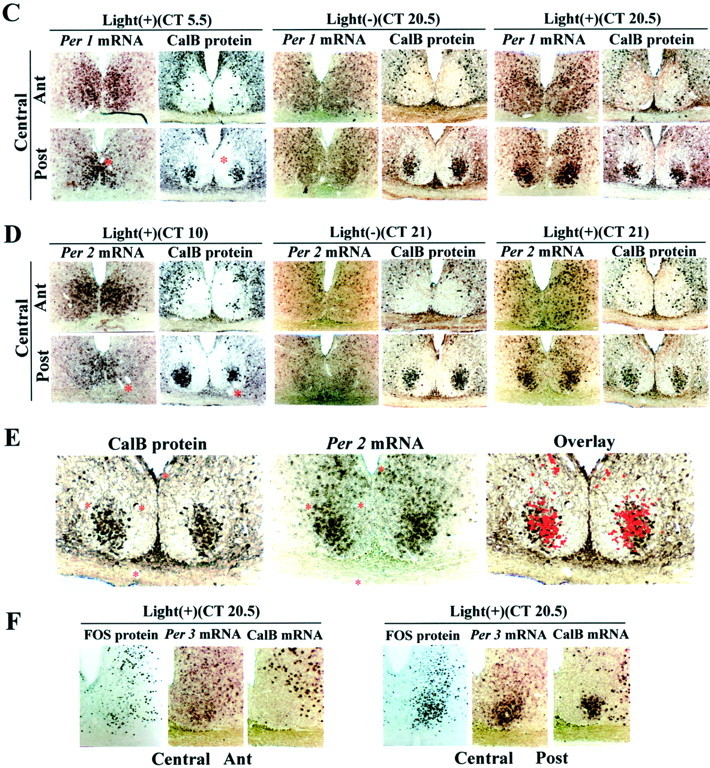
Photomicrographs depicting the localization of endogenously rhythmic (A, B) and light-induced (C–F) expression of Per1, Per2,and Per3 mRNA with respect to other known markers of the SCN, namely, CalB, VP, and FOS. Asterisks denote adjacent sections. A, The columns show coronal sections of each SCN quadrant from rostral to caudal from the same animal. At circadian times when Per1 andPer2 mRNA expression peaks (CT4, CT8, respectively), both signals are localized to the VP region of the SCN, and there is little expression (background level) in the CalB region of the central SCN, posterior aspect. This is highlighted in higher-power photomicrographs (B) in which the image of thePer1mRNA at ZT4 is captured in Adobe Photoshop, converted to a red signal, and superimposed in an overlay on the image of the adjacent section immunoreacted for CalB. The last two columns of A showPer3 mRNA at two circadian times, CT5 andCT20.5. Comparison of expression in each SCN quadrant at these times reveals weak Per3 rhythmic expression outside the CalB region. In contrast to Per1,Per2, and VP mRNA, Per3 mRNA is strongly expressed in the CalB region at both CT5 and CT20.5 but is not rhythmic. C, D, Comparison of responses in the presence and absence of light [Light(+) vsLight(−)] indicates that photic input induces Per1 (C) andPer2 (D) mRNA expression in the CalB region. The light-induced response can be seen during subjective night (CT20.5, Per1; CT21,Per2) but not during subjective day (CT5.5, Per1; CT10,Per2). Note that light-induced Per1 andPer2 mRNA and rhythmic Per1 andPer2 mRNA are expressed in different SCN compartments.E, Data shown in C and Dhighlighted in a high-power photomicrograph and overlay in which the image of the Per2 mRNA is captured in Adobe Photoshop, converted to a red signal, and superimposed in an overlay on the image of the adjacent section immunoreacted for CalB protein. The time of killing is given at the top of eachcolumn. Light(+), Presentation of a light pulse (600 lux for 30 min);light(−), no light pulse. Eachcolumn shows sections from two central SCN quadrants [anterior (Ant) and posterior (Post)] of the same animal. F,Photomicrographs showing the localization of light-induced FOS,Per3, and CalB mRNA in the central anterior and posterior aspects of the SCN. It is clear that light induces FOS in the CalB region of the SCN. Comparison of Per3 atCT5 in A and at CT20.5 in F indicates that light does not affect the expression of eitherPer3 or CalB mRNA.