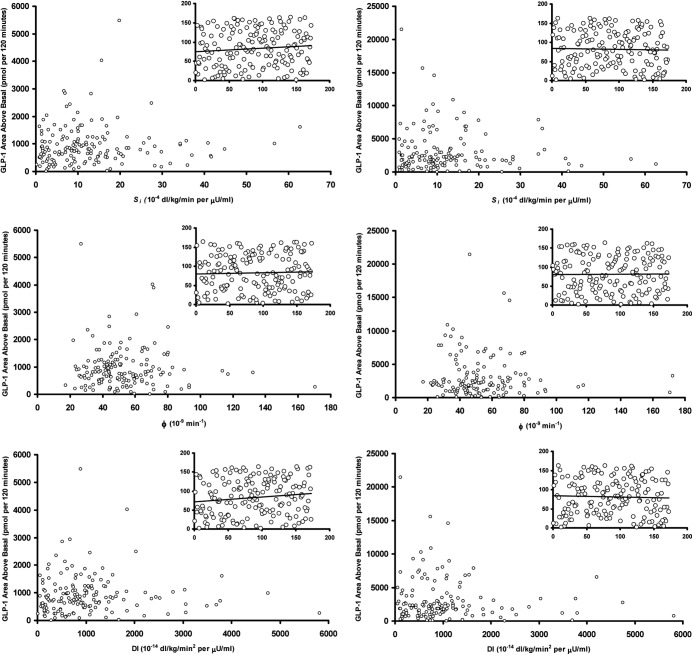
Fig. 4.
Relationship of Si (upper panel), φ (middle panel), and DI (lower panel) with integrated postchallenge active (left column) and total (right column) integrated GLP-1 concentrations. The inset panels represent the rank transformed values of these indices plotted against AAB active and total GLP-1 values.

