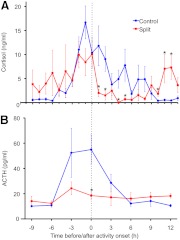
Fig. 2.
Mean plasma cortisol and ACTH 24-h profiles from control and split hamsters. A, Twenty-four-hour plasma cortisol of control (blue; n = 6–8) and split (red; n = 4–6) hamsters. B, Twenty-four-hour plasma ACTH of control (blue; n = 4–6) and split (red; n = 6–8) hamsters. Onset of wheel-running activity is indicated by dotted line. Data are shown as mean ± sem. *, P < 0.05 vs. control.

