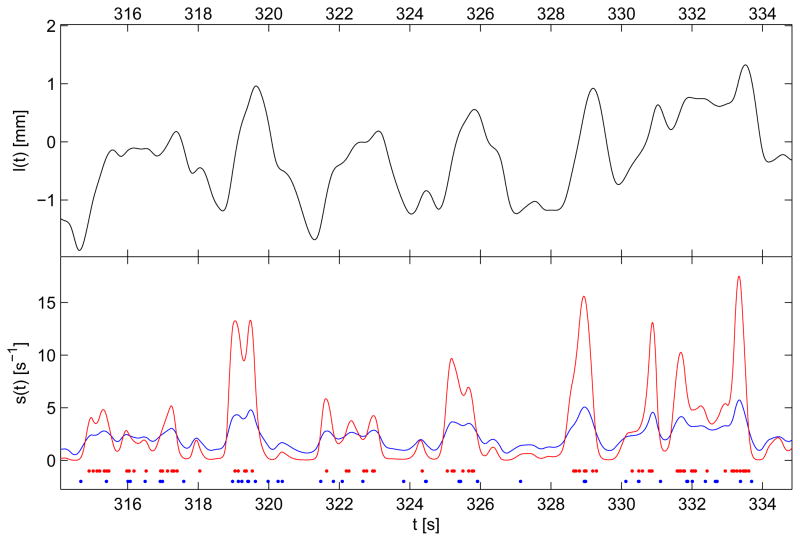
Fig. 3.
The upper plot shows a few seconds of the muscle extension l(t). The lower plot presents the stimulus intensity function s(t) and the raster plot of the spike clusters 4 (red) and 8 (blue). The stimulus intensity function has been evaluated substituting the corresponding parameters from Table I in (8).

