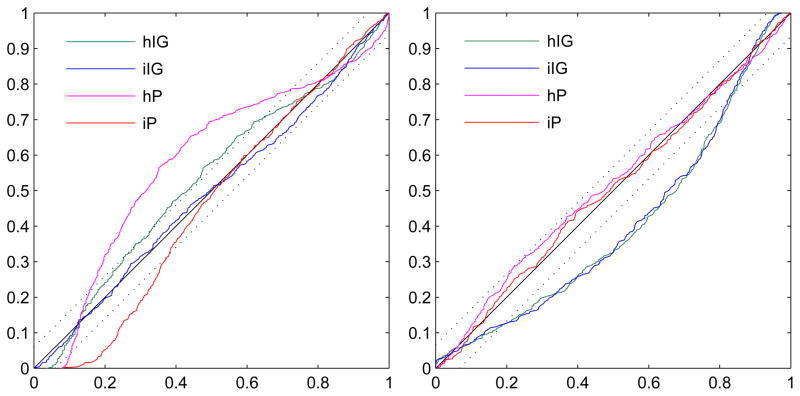
Fig. 4.
K-S plots of the four models for the spike clusters 4 (left) and 8 (right). For cluster 4, neither the homogeneous nor the inhomogeneous Poisson distributions fit the data adequately. The homogeneous inverse Gaussian provides a better fit but still outside the confidence bounds. On the contrary, the inhomogeneous inverse Gaussian presents a very good fit of the data meaning that it captures both the time structure of the ISIs and their dependence on the input. Cluster 8 shows a specular situation where the two inverse Gaussian distributions fail to fit the data while both the two Poisson distributions are within the confidence bounds, with the inhomogeneous Poisson being slightly closer to the 45°line.

