Figure 3.

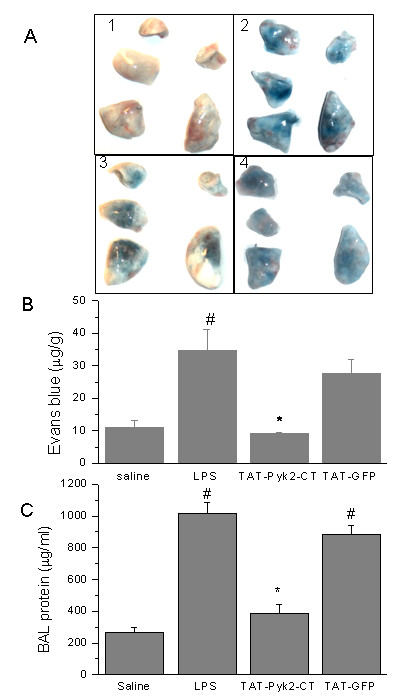
Effects of Pyk2 inhibition on LPS- induced lung microvascular permeability. A. Images of the lungs represent Evans blue leakage into lung tissue. Lung vascular permeability was assessed by Evans blue accumulation in the lungs as described in the Materials and Methods. Results are representative of four independent experiments. 1. Saline control; 2. LPS; 3, TAT-Pyk2-CT + LPS; 4. TAT-GFP + LPS. B. Evans blue extravasation was quantified by spectrophotometry. Values are means ± SEM; n = 4 per condition. #P < 0.05 vs. control group; *P < 0.05 vs. LPS alone group. C. Protein concentration was measured in BAL taken from control and LPS-challenged animals. The values presented were the means ± SEMs (n = 4 for saline control and 6 each for LPS challenged groups). #P < 0.05 vs. control group; *P < 0.05 vs. LPS alone group.
