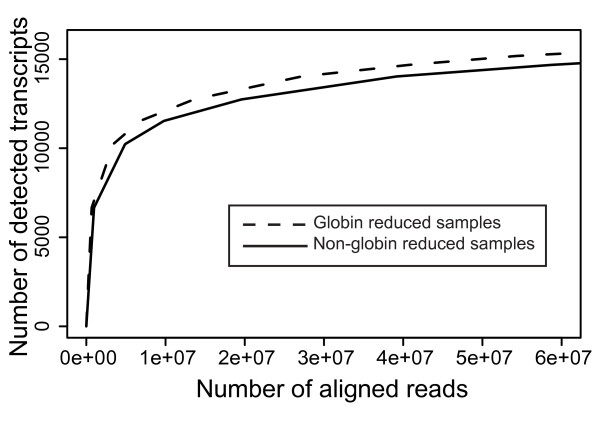
Figure 5.
Number of transcripts detected at increased sampling rate. In silico analysis using the sum of aligned reads (total number of reads ~60 million) across each group (reduced, non-reduced). A random subset of these aligned reads is then used to find the number of detected transcripts across the two sample groups over the 5 tag, 5 out of 6 samples threshold. The plot shows that at similar sequencing depths, there is a consistently higher number of transcripts detected in the globin reduced samples compared to the non-globin reduced samples.

