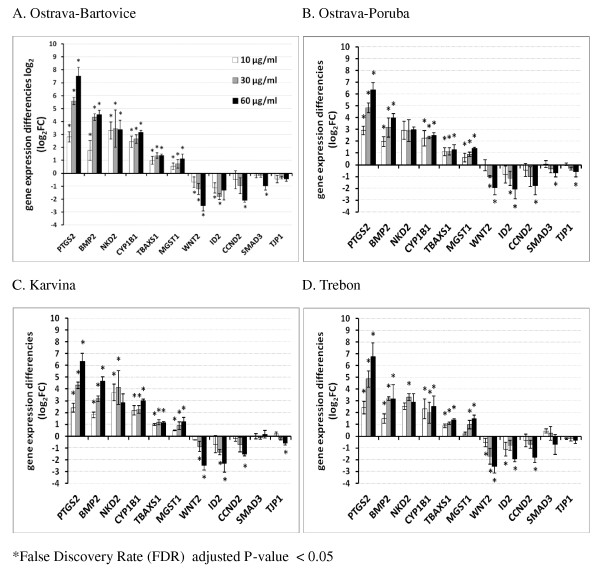
Figure 6.
Gene expression changes (gene expression difference log2) of 11 selected genes representing various deregulated pathways (see Table 4) as detected by quantitative RT-PCR. HEL cells were treated with 10, 30 and 60 μg/ml of organic extracts from PM2.5 particles. All transcripts from all localities (with the exception of SMAD 3 for Karvina and Trebon and TJP1 for Trebon) were significantly deregulated in a dose-dependent manner (P-value of the Jonckheere-Terpstra monotonicity test was < 0.05).

