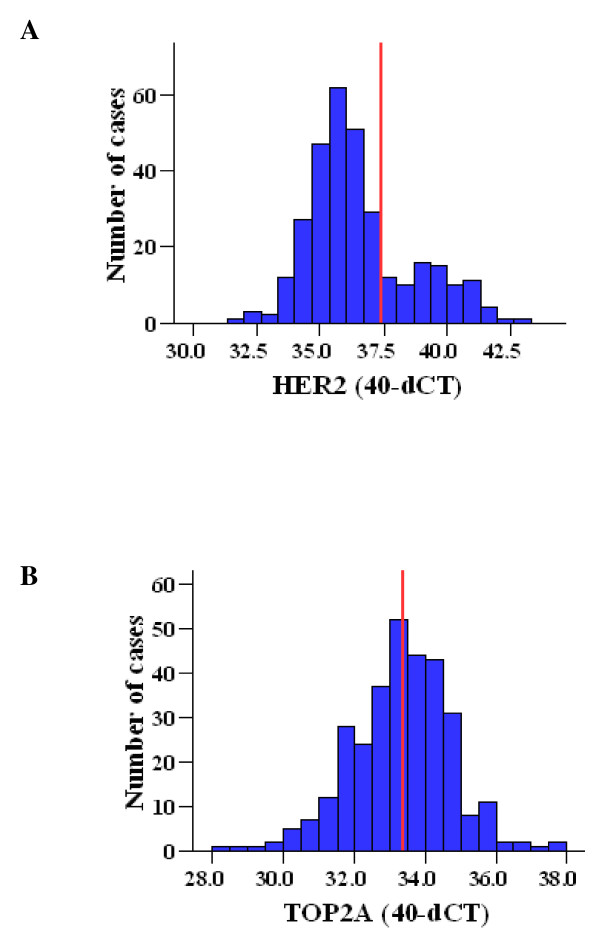
Figure 3.
Distribution of relative mRNA expression (40-dCT values) for A) HER2 (median: 36.02, 25th percentile: 35.20, 75th percentile: 37.41) and B) TOP2A (median: 33.38, 25th percentile: 32.46, 75th percentile: 34.18). Red lines represent the cut-offs used (75th percentile for HER2 and median for TOP2A).

