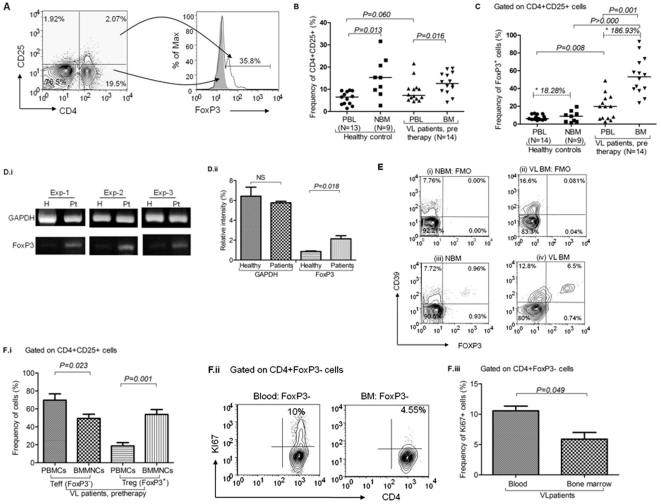
Figure 1. Enrichment of Treg cells at the disease site of visceral leishmaniasis (VL) patients:
A) Enumeration of FoxP3+ Treg cells: On gated lymphocytes, expression of CD4 and CD25 was defined and subsequently expression of FoxP3 was observed among gated CD4+CD25+ cells. Overlay histogram shows FoxP3+ cells are exclusively present among CD4+CD25+ T cells (thin line) and absent among CD4+CD25− population (solid line). B) Increased frequency of CD4+CD25+ cells at disease sites: Dual positive cells were enumerated among the MNCs isolated from the peripheral blood, bone marrow (BM) of VL patients (n = 14), peripheral blood of HCs (n = 13) and normal bone marrow (NBM; n = 9). CD4+CD25+ cells were significantly enriched in BM-MNCs as compared to PBMCs of VL patients (p = 0.016, unpaired t test). A statistically non-significant increase is also observed in PBMCs of VL patients in comparison with that of HCs (p = 0.060, Unpaired t test). Horizontal lines in dot plot depict median value. C) Increased frequency of CD4+CD25+FoxP3+ cells in BM of VL patients: Significant increase in frequency of CD4+CD25+FoxP3+ cells in PBMCs of patients (n = 14) as compared to that of HCs (n = 13; p = 0.009, unpaired t test). CD4+CD25+FoxP3+ cells are further enriched in BM-MNCs at disease site (n = 15) as compared to their autologus PBMCs (n = 14; p = 0.001, paired t test) and NBM (n = 9; p>0.000, unpaired t test). Horizontal lines in dot plot depict median values. Asterix values are enrichment ratios {ER = (Mean of Treg in BM- blood)/Mean of Treg in blood ×100) of FoxP3+ Treg cells in the NBM (ER = 18.26.%) and VL patient's BM (ER = 186.93%) relative to peripheral blood. D) Increased expression of FoxP3 mRNA in PBMCs of patients: (i) Photograph depicts increased expression of FoxP3 mRNA in PBMCs of VL patients than that of HCs. Three individual experiments are shown herewith. (ii) Relative density analysis shows increase in FoxP3 mRNA in patient's PBMCs (p = 0.018, unpaired t test). However, GAPDH expression remains unchanged in both the group. E) CD4+FoxP3+CD39+ cells are increased in the VL-BM: Data shows higher frequency of CD4+FoxP3+CD39+ cells at the disease sites of VL patients (iv; 6.5%) as compared to NBM (iii; 0.96%). Contour plots i and ii show fluorescence minus one (FMO) staining for iii and iv respectively. F) FoxP3+ (Treg) and FoxP3− (Teff) cells within gated CD4+CD25+ cells: i) Bar diagram showing significant increase in the frequency of Treg cells in the BM-MNCs (disease site) of VL patients (n = 14) than that of PBMCs (p = 0.001, paired t test). However, the frequency of Teff cells at disease site (BMMNCs) is decreased as compared to peripheral compartment (PBMCs) (Mean±SEM, p = 0.023, paired t test). ii) FACS plot shows in vivo proliferating (Ki67+; an intra nuclear cells proliferating antigen) CD4+FoxP3− (Teff) cells in blood and BM of freshly diagnosed VL patients. iii) Significant reduction in the proliferating Teff cells obtained from the disease site of VL patients was observed (n = 3; Mean±SD, p = 0.049, unpaired t test).

