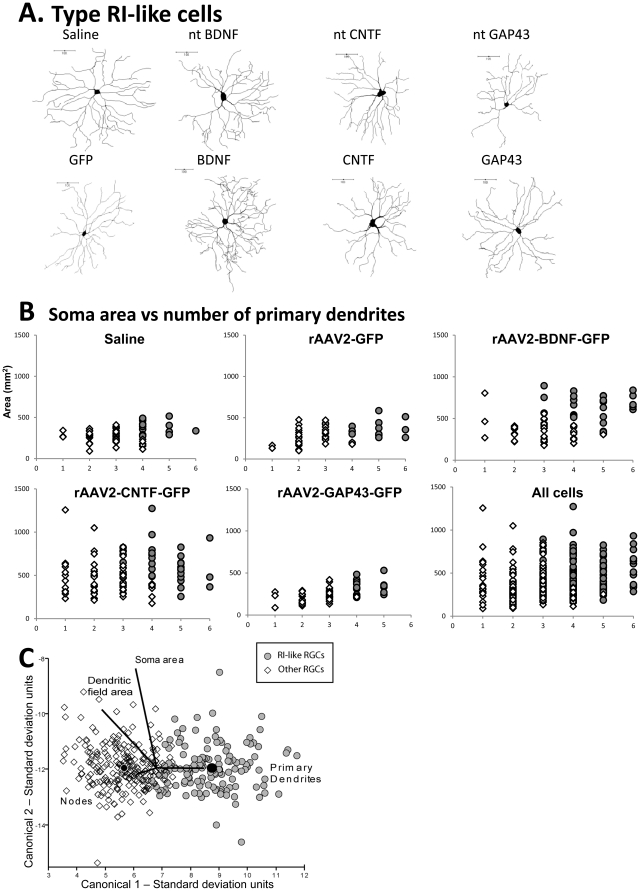
Figure 4. Classification of RI-like RGCs.
A: Neurolucida traces of representative RI-like retinal ganglion cells (RGCs) from control and experimental rAAV2 groups. Transduced and non-transduced (nt) FG+ RGCs in the 4 rAAV2 groups are labeled as GFP/ntGFP, CNTF/ntCNTF, BDNF/ntBDNF or GAP43/ntGAP43 respectively. B: Clustering of transduced and ntRI-like RGCs based on the number of primary dendrites (X-axis) and soma area (Y axis) in control and experimental groups. RI-like RGCs are denoted by grey circles and remaining cells by white diamonds. C: Plot showing canonical scores 1 (X axis) and 2 (Y axis) from a multivariate discriminant analysis of dendritic morphology of RI-like RGCs and “other” RGCs. Plots show the first two canonical scores that together represent more than 80% of the variance. Axes represent units of standard deviation. Solid black circles represent the 95% confidence region to contain the true mean of the group. Black lines show the coordinate direction (i.e. morphological parameters measured in Neurolucida) in canonical space. Note that the length of the lines is not representative of effect size due to the multidimensional nature of the analysis.

