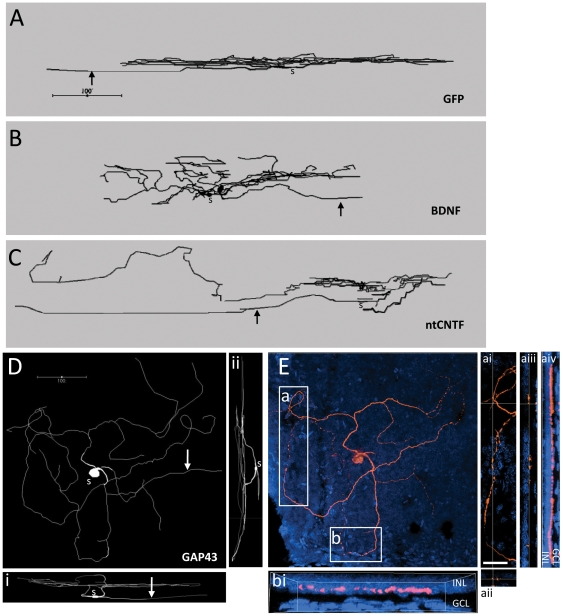
Figure 6. Abnormal stratification in RGCs from retinae injected with rAAV2 encoding different transgenes.
A–C: Side views of Neurolucida traces showing examples of abnormal stratification in each rAAV2 treatment group. Arrows indicate axons and “s” is immediately below the soma. The scale bar in A applies to the three traces. D: Neurolucida trace of an rAAV2-GAP43-GFP transduced retinal ganglion cell (RGC). Ai and Aii are side views. E: confocal image of the same cell as in D; pink is Cy3 immunofluorescence for lucifer yellow, wholemount counterstained with Hoechst 33342 (blue). Areas a and b are shown in more detail. Area a is shown in panels ai-aiv. Panel ai shows a higher power magnification of a and panels aii and aiii show the XZ and YZ projections respectively at the crosshairs shown on panel ai. Panel aiv shows the full YZ projection of panel a and shows that dendritic processes descend through the inner plexiform layer and run along the border of the inner nuclear layer (INL), but they do not enter the INL. Area b is shown in panel bi as an XZ projection showing the relationship of this dendritic branch to the INL. GCL, ganglion cell layer. Scale bar in ai: 25 µm.

