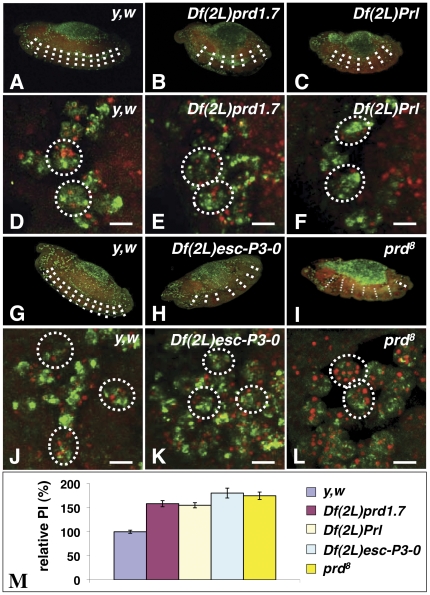
Figure 2. Phenotypic characterization of all three deficiencies and the prd[8] null-allele.
In A–L embryos were aged to stage 13, fixed, their macrophages immunostained with the CRQ Ab (green) and apoptotic corpses detected with 7-AAD staining (red). Confocal images of twelve focal plans taken through macrophages were merged and projected. A–C are 20× lateral views of a wild-type embryo (A), Df(2L)prd1.7 (B) and Df(2L)Prl (C) homozygous mutant embryos. Homozygous embryos of both Df(2L)prd1.7 (B) and Df(2L)Prl (C) deficiencies show only 6 out of the 12 segments normally observed in wild-type embryos (A), as highlighted by dotted white lines. D–F are respective magnified views of macrophages found in the head regions of these embryos, In both homozygous Df(2L)prd1.7 (E) and Df(2L)Prl (F) mutants, macrophages are able of efficiently engulf multiple apoptotic corpses. Scale bars in panels D–F are 5 µm. G–I are 20× lateral views of a wild-type embryo (G), Df(2L)Esc-P3-0 (H) and prd[8] (I) homozygous mutant embryos. As expected the deletion of the paired gene causes a segmentation defect in both Df(2L)Esc-P3-0 and prd-null mutant embryos. As seen in Df(2L)prd1.7 (B) and Df(2L)Prl (C), Df(2L)Esc-P3-0 (H) and prd[8] (I) homozygous mutant embryos also have only 6 out of the 12 segments normally observed in wild-type embryos (A and G) due to their loss of prd function. J–L are higher magnification views of macrophages within the head of Df(2L)Esc-P3-0 and prd[8] homozygous mutant embryos, respectively. Mutant macrophages in both Df(2L)Esc-P3-0 (K) and prd-null (L) homozygous embryos efficiently engulf multiple apoptotic corpses, with prd-null macrophages occasionally engulfing up to 12 corpses. Scale bars in panels J–L are 5 µm. Phagocytic indices for wild-type, the deficiencies, and the prd-null mutant embryos have been quantified and are summarised in a graph in M. PIs calculated from three image-stacks taken from 5 to 15 embryos of each genotype were normalized against wild type (with wild-type relative PI set as 100%) and are presented as relative PIs ± standard error of the mean (SEM) for each genotype. In D–F, and J–L, dotted white circles are indicative of individual macrophage cell bodies based on 7-AAD staining of their regular nuclei and CRQ staining.

