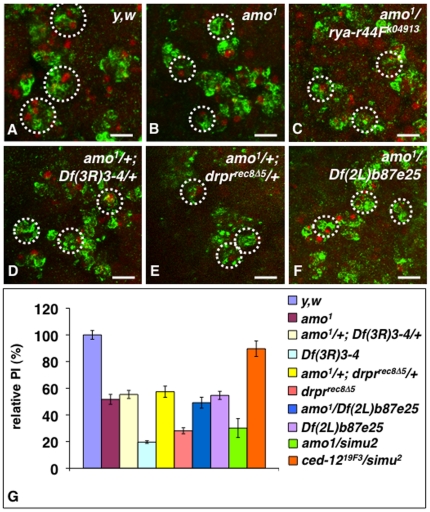
Figure 6. Genetic interactions between pkd2, uta and drpr null alleles reveal a role for pkd2 in phagocytosis of apoptotic cells.
In A–F are projected confocal images of macrophages in stage 13 y,w (wild-type) embryos (A), amo1 homozygous embryos (B), amo1/rya-r44Fk04913 heterozygous embryos (C), double heterozygous amo1/+; Df(3R)3-4/+ (D) and amo1/+; drprrecΔ5/+ (E) embryos, and amo1/Df(2L)b87e25 heterozygous embryos (F). All embryos were stained with the CRQ Ab (green) and 7-AAD (red). Embryos in B–F had macrophages that were smaller and less efficient at engulfing apoptotic cells than that of wild-type embryos (A). In G is a graph summarizing the PIs of wild-type (y,w), amo1, rya-r44Fk04913, rya-r44F16, Df(3R)3-, drprrecΔ5 and Df(2L)b87e25 homozygous macrophages, that of amo1/rya-r44F16, amo1/rya-r44FK04913, amo1/Df(2L)b87e25 and ced-1219F3/simu2 trans-heterozygous macrophages, as well as that of amo1/+;Df(3R)3-4/+ and amo1/+; drprrecΔ5/+ double heterozygous macrophages. Each bar represents the mean value ± SEM of the relative PIs for each genotype. Scale bars in panels A–F are 5 µm. In A–F, dotted white circles are indicative of individual macrophage cell body based on 7-AAD staining of their regular nuclei and CRQ staining.

