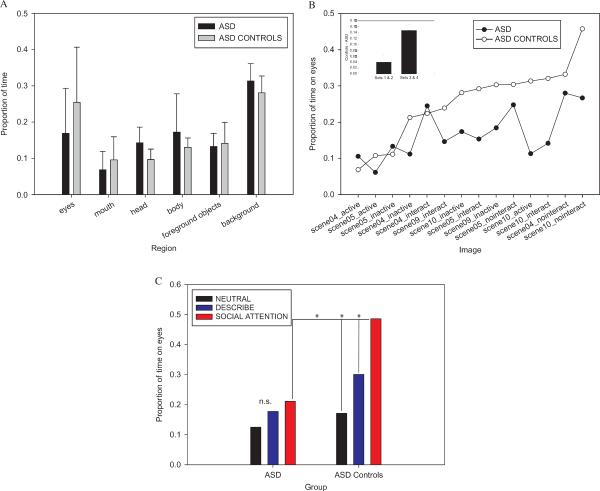
Figure 4.
Fixations in ASD. (A) Proportional dwell time for each region of interest, for ASD and ASD controls (means and SD). (B) Dwell time broken down by individual stimuli. Sets 3 and 4 produced larger group differences than Sets 1 and 2 (p < .05). (C) Group and task effects for proportion of dwell time on eyes for images in Sets 3 and 4. Whereas ASD controls enhanced their fixations to the eyes in the Social Attention task (p < .05), the ASD group did not.

